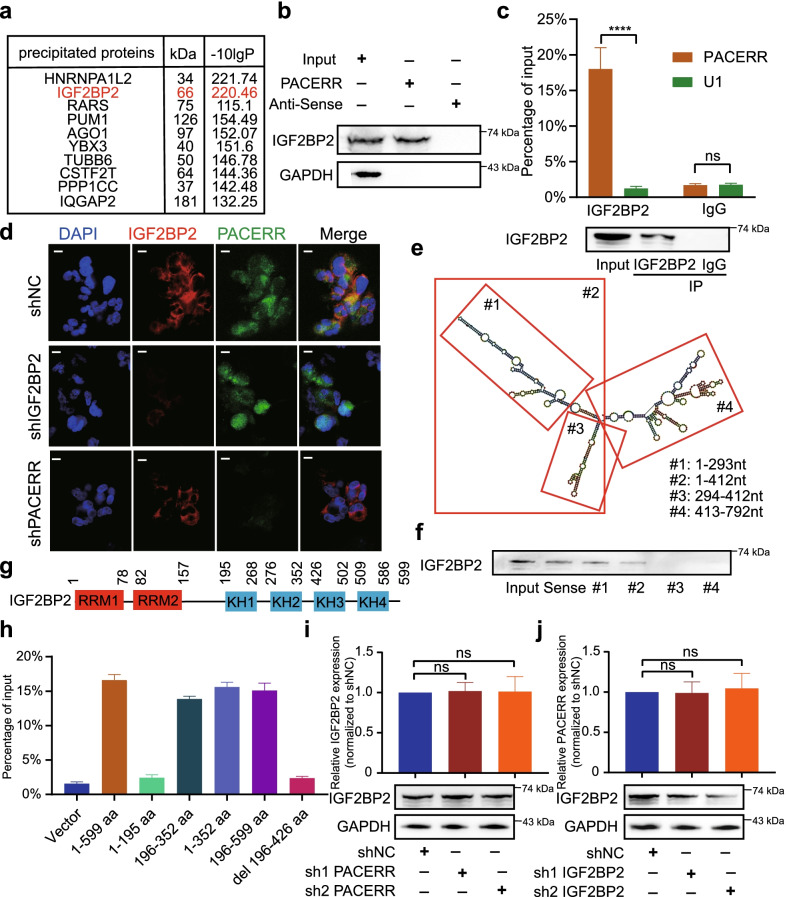
Fig. 7.
LncRNA-PACERR directly binds with IGF2BP2 in TAMs. A Visualization of protein bands by biotin-labelled LncRNA-PACERR RNA probes incubated with total protein extracts from THP-1 derived TAMs. B Immunoblotting to determine the specific association of IGF2BP2 with biotinylated LncRNA-PACERR. C qRT-PCR analysis of LncRNA-PACERR enriched by IGF2BP2 in THP-1 derived TAMs (top). Immunoblot of IGF2BP2 is shown (bottom). IP, immunoprecipitation. D Images showing the colocalization of LncRNA-PACERR and IGF2BP2 in the IGF2BP2 KD and LncRNA-PACERR KD THP-1 derived TAMs. Scale bars: 20 μm. E Secondary structure of LncRNA-PACERR analysed by RNAfold web server and deletion mapping of biotinylated LncRNA-PACERR motifs, as indicated. The red boxes represent the remaining fragments of LncRNA-PACERR, with the corresponding number label in the corner. F Immunoblot showing the association of IGF2BP2 with biotinylated LncRNA-PACERR RNA strands and the above-mentioned biotinylated LncRNA-PACERR motifs. G Schematic structures showing six domains in IGF2BP2. H RIP analysis for LncRNA-PACERR enrichment in HEK293T cells transfected with the FLAG-tagged full-length or truncated IGF2BP2 constructs (n = 3). aa: amino acid. I qRT-PCR analysis of IGF2BP2 mRNA levels (top) and immunoblot of IGF2BP2 (bottom) in the LncRNA-PACERR KD cells (n = 3). J qRT-PCR analysis of LncRNA-PACERR levels (top) and immunoblot of IGF2BP2 (bottom) in the IGF2BP2 KD cells (n = 3). The results are presented as the mean ± SEM. *P < 0.05; **P < 0.01; ***P < 0.001; ****P < 0.0001, ns not significant

