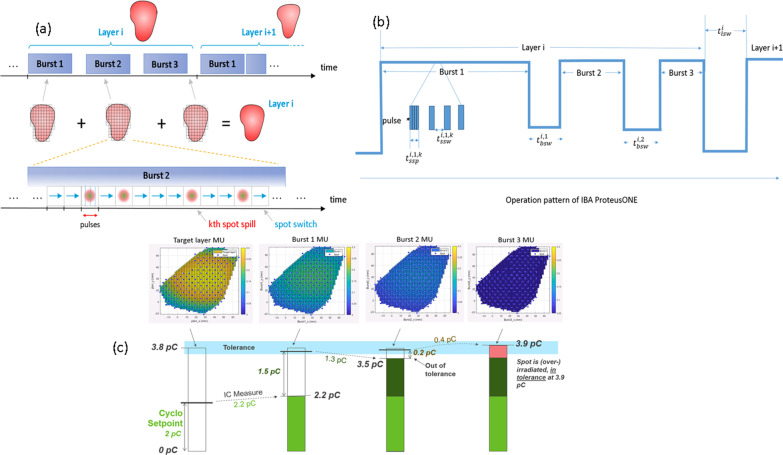
Fig. 1.
A schematic of the IBA ProteusONE® delivery sequence. a The pattern delivers through three radiation bursts per energy layer [17]. b The filled rectangles are the spot spill time , and the gaps between them are the spot switching time . The gap between consecutive bursts represents burst switching time and the gap between layers represents layer switching time . c An example of the IBA’s iterative layer delivery algorithm. This algorithm divides each energy layer normally in three radiation bursts such that the error in total charge delivered to each spot will not exceed the clinical tolerance [17]. The Monitor Unit (MU) distribution is displayed using a lung case as an example, with energy layer 156.2 MeV and 178 spots from a treatment field

