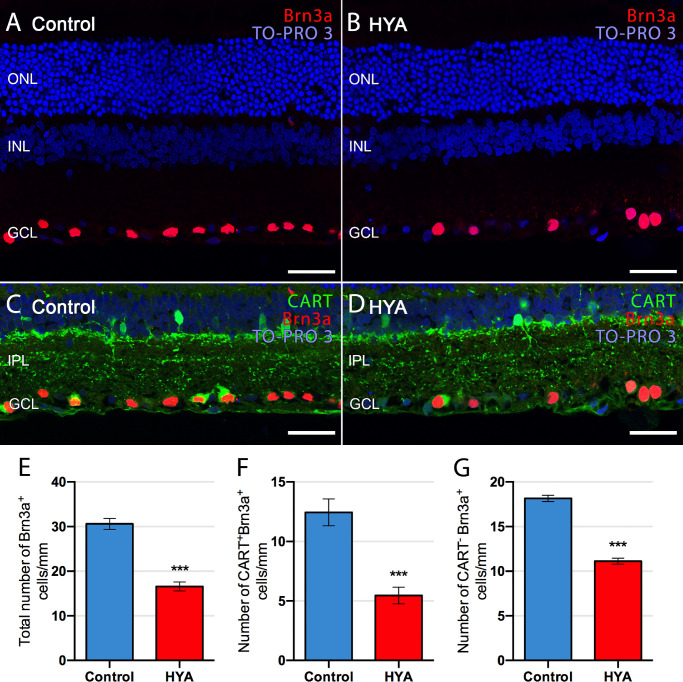
Figure 2.
Quantification of ganglion cells in control and sodium hyaluronate-treated eyes. (A–D) Cross-sections of the central retina from control (A, C) and HYA-treated (B, D) eyes immunostained for Brn3a (A, B, ganglion cells; red) or Brn3a and CART (C, D, ganglion cells, red; ON-OFF direction-selective ganglion cells, green). The nuclear marker TO-PRO 3 iodide (blue) was used to visualize all cell nuclei. (E–G) Quantification of total (E), CART+ (F) and CART− (G) ganglion cells per mm of retinal section in control (blue) and HYA-treated (red) eyes. ANOVA, Bonferroni's test, ***P < 0.001, n = 7 in each group. ONL, outer nuclear layer; GCL, ganglion cell layer. Scale bar: 40 µm.

