
Fig. 6. Precision, accuracy, and viability of photo-patterned microarray of human CD4 T cells on chip after overnight culture.
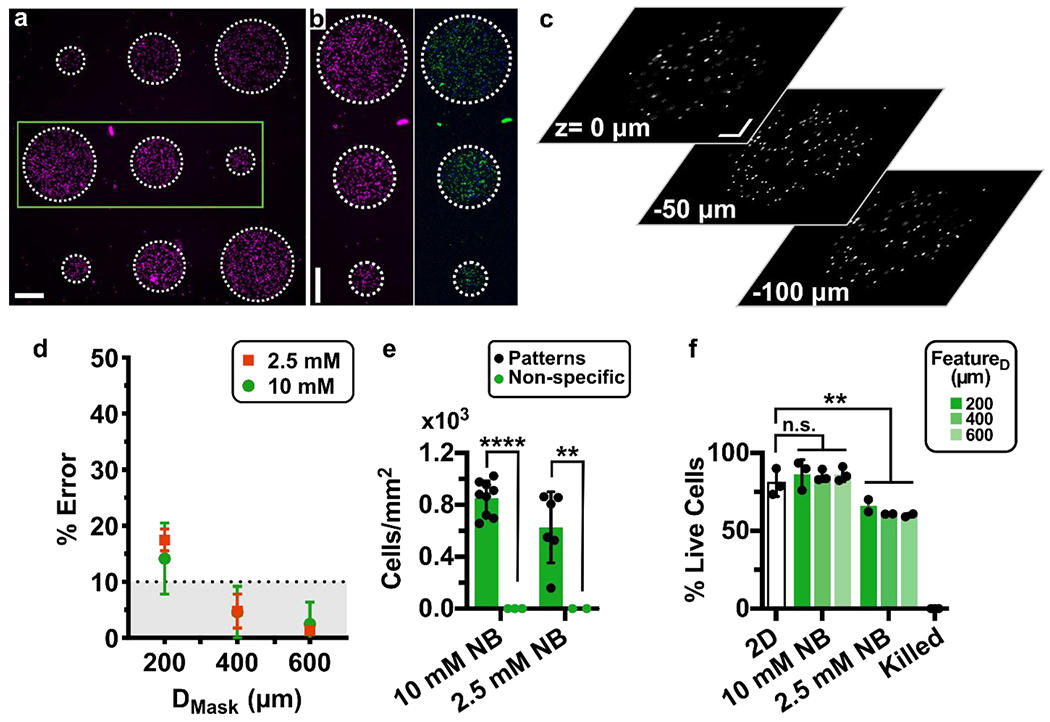
(a) Nine-circle culture array patterned on-chip with cells pre-labelled with NHS-rhodamine in GelSH hydrogels. Scalebar 250 μm. (b) Zoomed-in view of area outlined in green in panel 6a. (Left) Image of NHS-rhodamine labelled cells; (Right) image after viability staining with Calcein-AM (green) and DAPI (blue). Scalebar 250 μm. (c) Images from various z planes throughout a gel feature laden with NHS-rhodamine labeled cells (representative of 600 μm features in 3 chips). Scalebar 100 μm. Z: 0 μm is near the top of the chamber, near the PDMS layer and Z: −100 μm is near the bottom of the chamber, near the glass layer. Additional images in Fig. S7. (d) Percent error of the feature diameter of cell-laden features. Patterned features were perfused overnight and compared to the intended diameter from the photomask design. (e) Quantification of cell density inside and outside of the patterned regions (n=2 and n=3 chips respectively). Two-way ANOVA with Sidak’s multiple comparisons; **** p≤0.0001, ** p≤0.01. (f) Quantification of the viability of patterned CD4+ T cells in 5% GelSH with 2.5 and 10 mM NB hydrogels as a function of feature dimensions after overnight culture (12 hr) under continuous fluid flow, versus off-chip (2D) controls (n.s. p > 0.05, ** p≤0.01 One-way ANOVA with Tukey’s multiple comparisons, n=3 and n=2 for 10 mM and 2.5 mM NB chips, respectively).