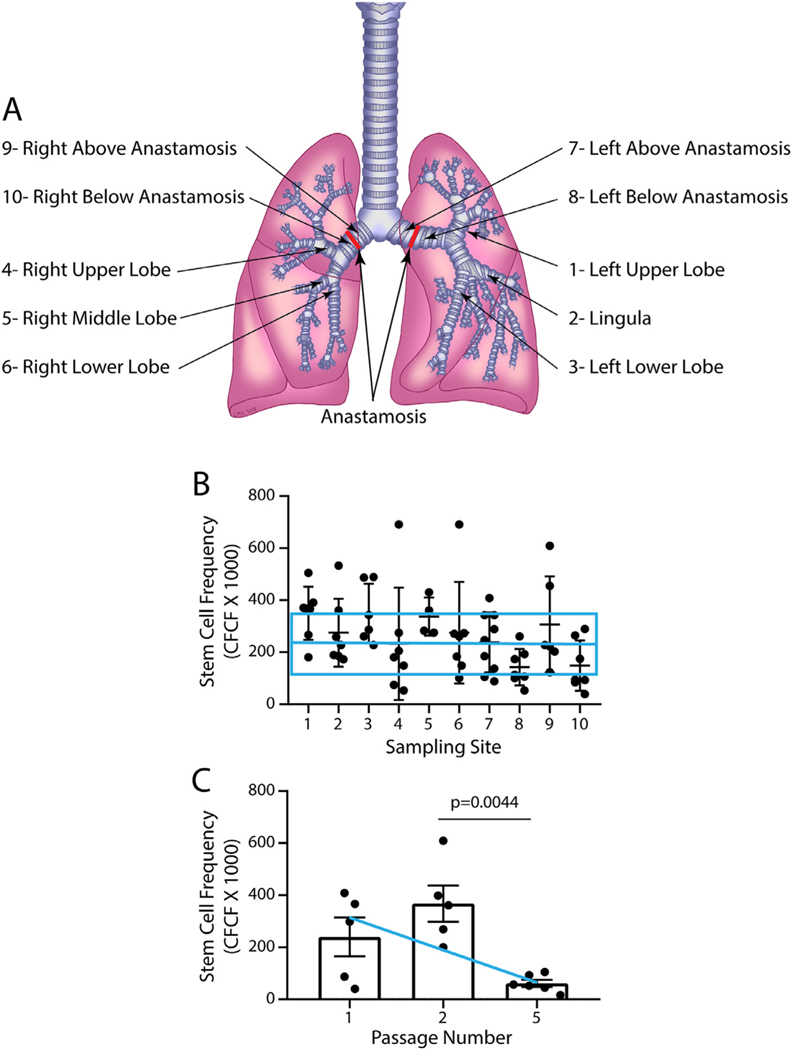
Fig 2.
TSC frequency and longevity. A. Sampling locations. 1, left upper lobe; 2, lingula; 3, left lower lobe; 4, right upper lobe; 5, right middle lobe; 6, right lower lobe; 7, left bronchus above the anastomosis; 8, left bronchus below the anastomosis; 9, right bronchus above the anastomosis; 10, right bronchus below the anastomosis. B. The clone forming cell frequency (CFCF) assay was used to determine the frequency of TSC at various sampling sites. The horizontal blue line and box represent the average CFCFx10 0 0 and standard deviation for CF patients who were sampled during sinus surgery [25]. Symbols represent individual data points. Data are presented as the medial and interquartile range, n = 6–10. Differences were evaluated by Kruskal-Wallis test. C. CFCFx10 0 0 was examined in a subset of samples that were serially passaged. The blue line indicates the average CFCFx10 0 0 for CF patients who were sampled during sinus surgery [25]. Symbols represent individual data points. Data are presented as the mean ± standard deviation, n = 5–6. Differences were evaluated by Student’s t-test. (For interpretation of the references to color in this figure legend, the reader is referred to the web version of this article.)

