. 2018 Feb 6;8(11):5902–5911. doi: 10.1039/c7ra12133d

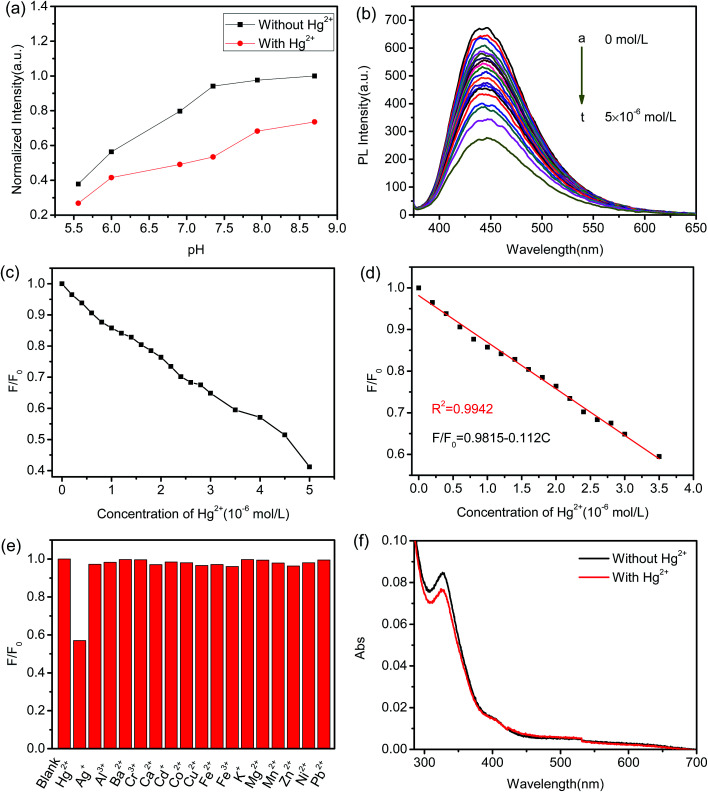
Fig. 6. (a) Fluorescence responses of Mn(ii)-NGQDs to different pH value of HMTA buffer under the absence and presence of 4 × 10⁻⁶ mol L−1 Hg2+ ions; (b) emission spectra (λex = 370 nm) of Mn(ii)-NGQDs in the presence of different concentrations of Hg2+ (0–5.0 × 10⁻⁶ mol L−1) in HMTA buffer solution (pH = 7.35). (a) 0 × 10−6 mol L−1, (b) 0.2 × 10⁻⁶ mol L−1, (c) 0.4 × 10⁻⁶ mol L−1, (d) 0.6 × 10⁻⁶ mol L−1, (e) 0.8 × 10⁻⁶ mol L−1, (f) 1.0 × 10⁻⁶ mol L−1, (g) 1.2 × 10⁻⁶ mol L−1, (h) 1.4 × 10⁻⁶ mol L−1, (i) 1.6 × 10⁻⁶ mol L−1, (j) 1.8 × 10⁻⁶ mol L−1, (k) 2.0 × 10⁻⁶ mol L−1, (l) 2.2 × 10⁻⁶ mol L−1, (m) 2.4 × 10⁻⁶ mol L−1, (n) 2.6 × 10⁻⁶ mol L−1, (o) 2.8 × 10⁻⁶ mol L−1, (p) 3.0 × 10⁻⁶ mol L−1, (q) 3.5 × 10⁻⁶ mol L−1, (r) 4.0 × 10⁻⁶ mol L−1, (s) 4.5 × 10⁻⁶ mol L−1, (t) 5.0 × 10⁻⁶ mol L−1; (c) the relationship between the F/F0 and Hg2+ concentrations (c: 0–5.0 × 10⁻⁶ mol L−1); (d) plots of intensity ratio of F/F0versus the concentrations of Hg2+ (0–3.5 × 10⁻⁶ mol L−1); (e) fluorescence responses of Mn(ii)-NGQDs to the different metal ions in HMTA buffer solution (pH = 7.35). The concentration of each metal ion is 4.0 × 10⁻⁶ mol L−1. F0 and F correspond to the fluorescence intensities of Mn(ii)-NGQDs at 440 nm with the 370 nm excitation wavelength in the absence and presence of metal ions, respectively; (f) the UV absorption spectra of Mn(ii)-NGQDs without Hg2+ and in the presence of Hg2+ (4.0 × 10⁻⁶ mol L−1).

Fig. 6