. 2018 Feb 13;8(13):6915–6924. doi: 10.1039/c7ra10981d

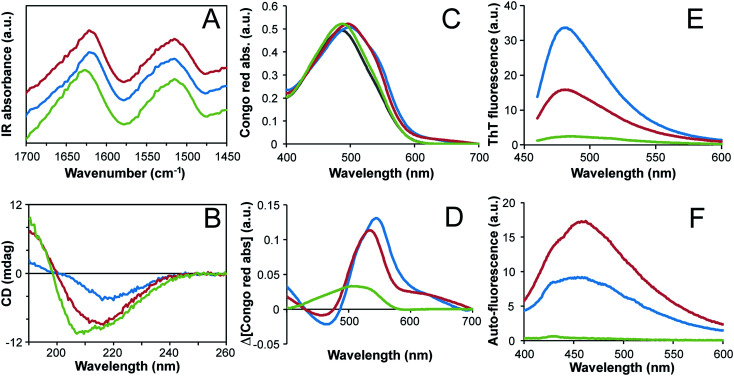
Fig. 5. Structural characteristics of straight (blue lines) and curved (red lines) fibrils compared to non-fibrillar WPI at pH 2 (green lines). The fibrils were purified by dialysis and all protein solutions were adjusted to similar protein concentrations based on absorbance at 280 nm and dry weight measurements. (A) FTIR spectra measured on dry protein films. Data are scaled to show similar peak absorbances in the amide I region. (B) Far-UV CD spectra of protein solutions. (C) Congo red absorbance spectra. The grey line is Congo red in solution without any protein. (D) Changes in Congo red absorbance spectra compared to the dye in absence of protein. (E) ThT fluorescence spectra with excitation wavelength = 440 nm. (F) Protein auto-fluorescence spectra with excitation wavelength = 375 nm. All solution measurements were performed at pH 2, except for the Congo red absorbance that was performed in PBS buffer, pH 7.4.

Fig. 5