. 2018 Feb 12;8(13):6781–6788. doi: 10.1039/c8ra00261d

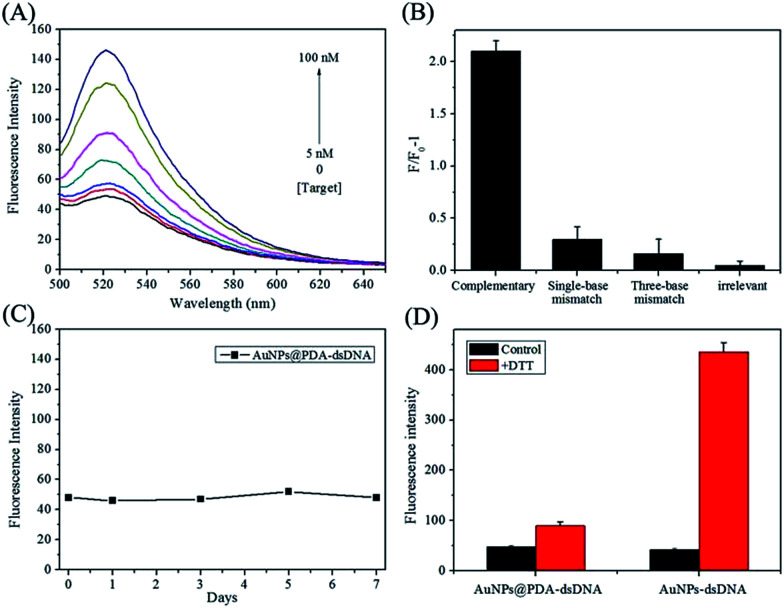
Fig. 2. (A) Fluorescence-emission spectra of the AuNPs@PDA-dsDNA solution upon the addition of different concentrations of miR-21 target; (B) fluorescence response (F/F0 − 1) of AuNPs@PDA-dsDNA towards the complementary target, single-base mismatch target, three-base mismatch target, and irrelevant sequence. F0 and F are fluorescence intensities in the absence and the presence of a target, respectively. The data shown represent the average of three independent experiments; (C) the time-dependent fluorescence intensity changes of the AuNPs@PDA-dsDNA solution; (D) the fluorescence intensity changes of AuNPs-dsDNA and AuNPs@PDA-dsDNA solutions after being treated with DTT. The data shown represent the average of three independent experiments.

Fig. 2