Abstract
5-Hydroxymethylfurfural (HMF) is a typical dehydration product of C6 carbohydrates, and it can be converted into a series of chemicals and liquid fuels. In this study, an advanced low-boiling single-phase reaction system consisting of water and 1,2-dimethoxyethane (DMOE) was proposed for the production of HMF from microcrystalline cellulose (MCC). AlCl3 and H3PO4 were selected as the Lewis acidic catalyst and Brønsted acidic catalyst, respectively, and the influence of these two catalysts on the conversion behavior of MCC was studied. The results showed that MCC could be selectively converted into HMF or levulinic acid (LA) by altering the solvent composition. As for the composition of the catalyst, high AlCl3 content favored the generation of HMF, whereas high H3PO4 content could decrease the HMF yield and promote the formation of glucose and fructose. The highest HMF yield of 49.42% was obtained at an AlCl3–H3PO4 ratio of 1 : 0.8. GC-MS analysis suggested that much MCC was transformed into furans and cyclopentenones in the presence of AlCl3, while anhydrosugars tended to be generated with a high H3PO4 proportion in the catalyst. Besides, FTIR analysis of the insoluble humin formed during MCC conversion indicated that AlCl3 could also facilitate the depolymerization of MCC.
An advanced single-phase reaction system consisting of water–DMOE solvent, AlCl3 and H3PO4 for high-efficiency HMF production from cellulose.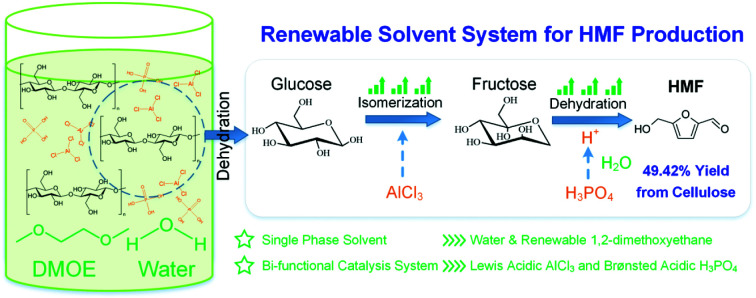
1. Introduction
In recent years, along with the rapid economic expansion all over the world, there is an increasing demand for energy and chemicals in human society.1,2 Furan compounds, which can be directly derived from biomass carbohydrates through dehydration, are very important precursors for many value-added chemicals and fuels.3,4 For example, a single dehydration process of C6 carbohydrates can form 5-hydroxymethylfurfural (HMF), which is an important biorefinery building block since it is crucial to the synthesis of a series of valuable chemical intermediates and liquid fuels like 2,5-furan dicarboxylic acid (FDCA), 2,5-dimethyl furan (DMF) and levulinic acid (LA).5,6 FDCA-derived polymer polyethylene furanoate (PEF) is used in the production of bottles, fibers and films; DMF can be an additive in current petroleum fuels; GVL is a hydrogenation product of LA and can be upgraded to fuel additives and jet fuels.7,8 Therefore, it is of great importance to develop efficient and economical reaction systems for the production of HMF.
Lignocellulosic biomass is one of the most promising feedstocks for HMF production as it can be easily obtained from nature. Especially, cellulose is a kind of macromolecular polysaccharide that is the most widely distributed and the most abundant on the earth, and it account for almost 50 wt% in biomass.9 Cellulose consists of a linear chain of several hundred to many thousands of β-1,4-glycosidic bond linked glucose units. Recent efforts have been primarily focused on the conversion of glucose and fructose to HMF in order to reveal the mechanisms involved in the production of HMF.10,11 However, in a practical point of view, cellulose is a much more reasonable feedstock for large-scale HMF production, even if it still faces several challenges such as its firm crystal structure and multiple side reactions.12
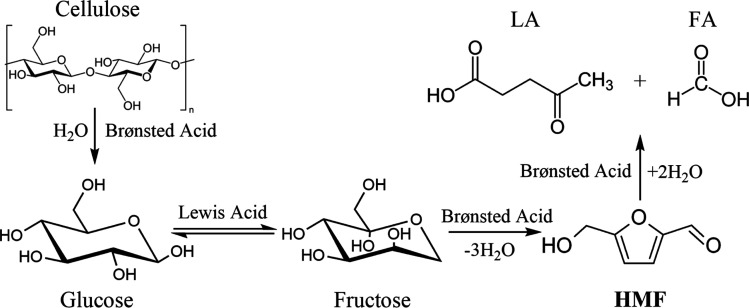
In a common conversion process from cellulose to HMF, cellulose is firstly hydrolyzed to form oligosaccharides and glucose, which was usually catalyzed by a Brønsted acid catalyst; then, with the aid of a Lewis acid catalyst, the isomerization of glucose occurs to form fructose, and fructose will undergo consecutive dehydration reactions to form HMF.13 Actually, glucose can also be directly dehydrated to generate HMF, but it is usually more difficult for this route to occur than the isomerization–dehydration route owing to the different conformer distribution of glucose and fructose solution.14,15 Consequently, it is a commonly recognized strategy to combine Lewis acid and Brønsted acid in the catalytic conversion of C6 carbohydrates to HMF. In addition to the catalyst, a good reaction medium is also an important aspect for efficient HMF production, since it could affect the distribution of intermediates and the selectivity of different products.16,17
Table 1 presents an overview of recent progress in C6 carbohydrates dehydration for HMF production in the presence of different solvents and catalysts. The synergistic effect of Lewis acidic catalyst and Brønsted acidic catalyst was reported to be pivotal for efficient production of HMF and its important derivative LA from C6 carbohydrates.18–22 Zhang et al. found that Lewis acidic AlCl3 and Brønsted acidic maleic acid could couple with each other to form catalytic complexes, which were able to favor the hydride shift in glucose for isomerization leading to enhanced reaction rates and HMF selectivity.22 In general, Lewis acid could promote the isomerization reaction from glucose, while Brønsted acid is significant for the hydrolyzation of polysaccharides and the dehydration of monosaccharides.19 AlCl3 was reported to be an attractive Lewis acidic catalyst among the metal chlorides for the conversion of glucose to HMF,21,22 and it also has great potential for commercial HMF production due to its low toxicity and low cost.23 Water is the most recommended solvent for its availability, but actually it was usually combined with polar aprotic solvent so as to get rid of side reactions (i.e., HMF rehydration).11 In recent years ionic liquids have been a focus of attention because it could overcome the physical and biochemical barriers of the cellulose hydrolysis reaction.24 Although the above solvent systems exhibited satisfying performance for HMF formation, product isolation could be a challenge for the downstream chemical processing. For instance, biphasic solvents required a large sum of organic extractant, and ionic liquids were expensive and hard to be evaporated out of the solution.6 Hence a green solvent with low boiling point was demanded to establish a single-phase reaction system in large-scale HMF production.25
C6 carbohydrates dehydration to HMF in acidic reaction systems.
| Reactant | Solvent (additive) | Catalyst | Temp. (°C) | Time (h) | HMF yield (%) | Ref. |
|---|---|---|---|---|---|---|
| Fructose | Water/isopropanol | CO2 | 180 | 2 | 67.1 | 16 |
| Glucose | Water/DMOE | AlCl3 | 150 | 0.75 | 58.5 | 26 |
| Glucose | Water/GVL | PTSA-POM/Sn-β | 140 | 0.5 | 60.1 | 19 |
| Glucose | Water (NaCl) | AlCl3/HCl | 170 | 3 | 62.0 | 27 |
| Cellulose | Water/MIBK | LPSnP-1 | 150 | 0.33 | 32.0 | 28 |
| Cellulose | Water/THF (NaCl) | Sn-Mont | 160 | 3 | 39.1 | 29 |
| Cellulose | Water (NaCl) | AlCl3/CPME | 190 | 60 | 42.0 | 21 |
| Cellulose | Water/THF | H2SO4 | 170 | 2 | 44.0 | 30 |
| Cellulose | Water/THF | NaHSO4/ZnSO4 | 160 | 1 | 53.0 | 31 |
| Cellulose | [BMIM]Cl | Cr([PSMIM]HSO4)3 | 130 | 5 | 53.0 | 32 |
Herein, a single-phase reaction system composed of renewable 1,2-dimethoxyethane (DMOE), water, AlCl3 and H3PO4 was proposed for HMF production from microcrystalline cellulose (MCC). DMOE is a renewable organic solvent that can be synthesized from bio-based ethylene glycol,33 and it is a polar aprotic solvent miscible with water. DMOE has low boiling point (84.6 °C) that is lower than commonly used polar aprotic solvents like dimethylformamide (DMF, 153 °C), dimethyl sulfoxide (DMSO, 189 °C) and γ-valerolactone (GVL, 207 °C), and therefore it requires a small amount of energy for separation through distillation. Moreover, studies have shown that polar aprotic solvent could improve HMF yields significantly, because of fewer side reactions that occurred in non-aqueous solvent.34 AlCl3 and H3PO4 were chosen as the Lewis acidic catalyst and the Brønsted acidic catalyst, respectively. The effect of water–DMOE ratio on product selectivity was investigated, followed by the influence of reaction temperature and time. Then the catalytic effect of Lewis acid and Brønsted acid was studied in depth by adjusting their mole ratio. The liquid-phase products and the solid insoluble humins formed at different AlCl3–H3PO4 mole ratios were analyzed by gas chromatography-mass spectrometry (GC-MS) and Fourier Transform Infrared Spectroscopy (FTIR), respectively.
2. Experimental section
2.1. Materials
Glucose, fructose, microcrystalline cellulose (MCC), HMF, LA and DMOE were purchased from Aladdin Industrial Corporation (Shanghai, China). AlCl3·6H2O and H3PO4 were purchased from Sinopharm Chemical Reagent (Shanghai, China). All chemicals were of analytical grade and were directly used without purification.
2.2. Procedure for conversion of cellulose to HMF
In a typical reaction process, a mixture of cellulose (10 mmol (1.8 g) based on monosaccharide units), solvent (water–DMOE at a specified volume ratio; 50 mL) and catalysts (AlCl3 and H3PO4) were placed in the Parr reactor (Parr Instruments, Moline, IL, USA; 100 mL). For different catalyst compositions, the mass of AlCl3 ranged from 0 to 0.133 g (0 to 1 mmol), while the mass of H3PO4 ranged from 0 to 0.098 g (0 to 1 mmol). The reactions were carried out under mechanical agitation in a N2 atmosphere, and the stirring rate was maintained at 300 rpm. After the preset reaction temperature and time were reached, heating was stopped and the reactor was cooled by airflow. Samples were filtered through a 0.22 μm syringe filter prior to high performance liquid chromatography (HPLC) and GC-MS analyses. Each experiment was repeated three times, and the resulting mean value and standard deviation are shown in the figures.
2.3. Analytical methods
The filtered solution was analyzed on a Dionex HPLC system (Dionex, Sunnyvale, CA, USA) equipped with a Bio-Rad Aminex HPX-87H column (Bio-Red, Hercules, CA, USA) and an RI 2000 refractive index detector (Schambeck SFD GmbH, Bad Honnef, Germany). H2SO4 solution (pH 2.5) was used as the mobile phase, and its flow rate and the corresponding column temperature were kept at 0.6 mL min−1 and 60 °C, respectively. The concentrations of glucose, fructose, LA, formic acid (FA) and HMF were determined by reference to standard calibration curves. The yields of hexoses (glucose and fructose), LA, FA and HMF were calculated as follows:


In order to understand the process of glucose decomposition, the filtered samples were also analyzed by GC-MS (Thermo Scientific, Trace DSQII) equipped with a DB-wax capillary column (30 m × 0.25 mm × 0.25 mm). Helium (99.999%) at a flow rate of 1 mL min−1 was used as carrier gas. The GC oven temperature was programmed to increase from 40 °C (1 min) to 240 °C (20 min) at 8 °C min−1 heating rate. The MS detector was operated in electron ionization (EI) mode (70 eV) with a scan range of m/z 35–450. All detected chemicals were identified by comparison with the NIST (National Institute of Standards) MS library.
2.4. Humins isolation and analyses
Insoluble polymeric humins from cellulose conversion process were obtained as follows. After reaction, the samples were filtered through a 0.22 μm organic filter membrane to obtain the insoluble residue. The remaining solid residues after washing with water were dried at 105 °C for 2 h, and the dry solid was considered as insoluble humins. FTIR spectra of the humins were recorded from 400 to 4000 cm−1 at resolution of 4 cm−1 on a Nicolet 5700 FTIR spectrometer by averaging 36 scans. The yield of humin was calculated as the mass of cellulose divided by the mass of humins.
3. Results and discussion
3.1. Effect of solvent composition
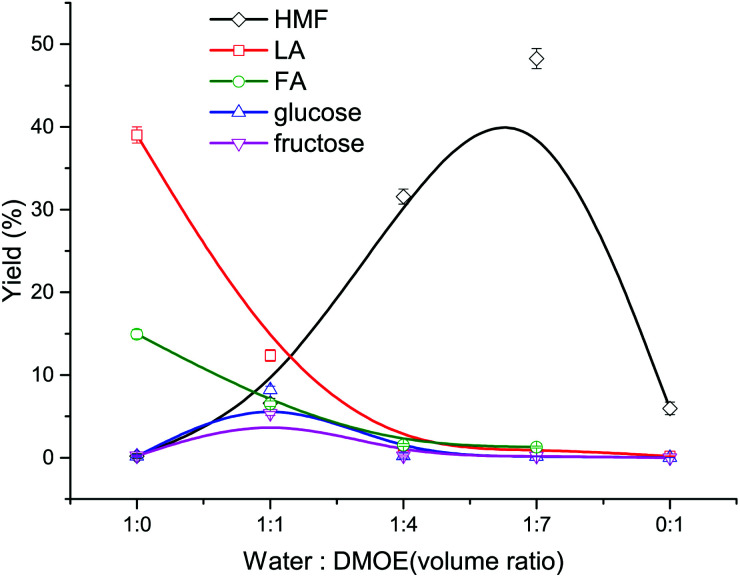
At first, the mixtures of water–DMOE (7 : 1) and AlCl3/H3PO4 catalysts before and after heating at 180 °C for 2 h were analyzed by GC-MS. The results showed no decomposition behavior of DMOE, and therefore DMOE was stable in the reaction system. As described in Fig. 1, the solvent composition has a great influence on the typical product distribution from cellulose. In pure water solvent, the main product formed from cellulose were LA with a high yield of 39.01% and FA with a yield of 14.94%, while the yield of glucose, fructose and HMF remained at pretty low levels (<0.5%). Theoretically, LA would be produced in a 1 : 1 ratio with formic acid from HMF rehydration. However, this ratio could be greater than, equal to or less than 1 : 1 in experiments under different conditions.35 For instance, Asghari et al. found that when catalyzed by hydrochloric acid, FA could decompose faster than LA after they were generated from HMF rehydration, leading to a much higher yield of LA than that of FA.36 However, when the organic solvent DMOE was gradually added into the solution until the DMOE–water ratio reached 7 : 1, the yield of LA and FA showed a steep drop while the yield of HMF rose rapidly to 48.27%. Besides, both the yield of glucose and fructose increased at first and decreased thereafter, and their maximum yields of 8.20% and 5.35% were arrived at a DMOE–water ratio of 1 : 1, respectively. The results suggested significant effects of solvent on the degradation route of cellulose when catalyzed by H3PO4 and AlCl3.
Fig. 1. Effect of solvent composition on the product distribution from cellulose conversion (180 °C, 120 min, 0.02 M AlCl3, 0.02 M H3PO4, 36 mg mL−1 cellulose).
In pure water solvent, cellulose could be hydrolyzed adequately with the help of Brønsted acid to generate glucose, and subsequently the glucose was catalyzed by Lewis acid to undergo isomerization reaction. Afterwards the formed fructose was dehydrated to form HMF in the presence of Brønsted acid, and HMF was easily rehydrated in the water-rich environment, resulting in the formation of LA and FA. Thus, the synergistic catalytic effect of Lewis acid and Brønsted acid in aqueous solvent could be utilized to transform cellulose or glucose into LA. For example, Yang et al. achieved a LA yield of 49.8% in a reaction system containing H3PO4 and CrCl3.37 Nemoto et al. used H3PO4 and AlCl3 as catalysts to convert cellulose into LA and a maximum LA yield of 50% was obtained.38 Along with the increasing proportion of DMOE and the decreasing water content, the generated HMF could be protected by the increasing non-aqueous solvent (DMOE) concentration and the hydrogen-bond interaction between DMOE and HMF.26 In this way the formation of LA and FA was inhibited and the reactive HMF could be preserved.
In pure organic solvent, all of these products were hardly formed, and the yield of HMF was as low as 5.96% (not shown in Fig. 1). It was extremely difficult for cellulose to be hydrolyzed towards monosaccharides without water, and therefore further reactions would hardly occur. In spite of this, there was still a little HMF that could be detected, which might come from other reaction paths. Weingarten et al. reported the production of HMF from cellulose in polar aprotic solvents without the presence of water, and they deemed that the cellulose firstly degraded to form levoglucosan, which was then dehydrated to generate HMF.30
3.2. Effect of reaction temperature and time
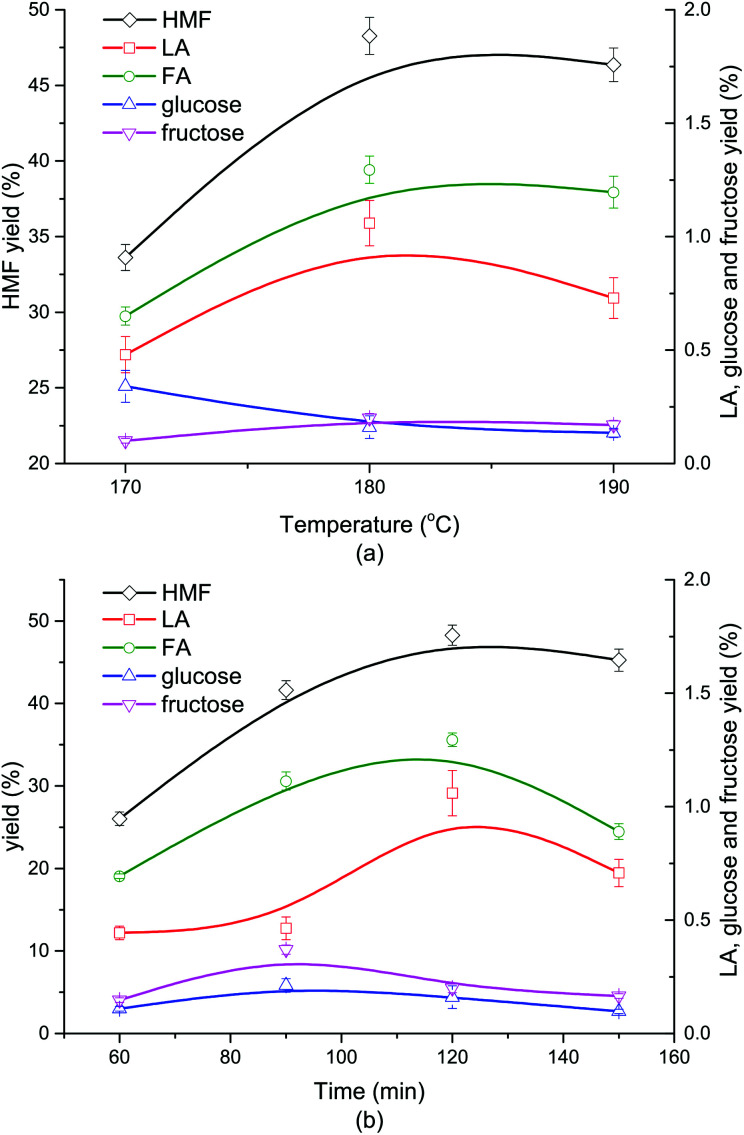
As shown in Fig. 2a, when the reaction went up from 170 °C to 180 °C, the yield of HMF grew from 33.62% to 48.27%, correspondingly. Nevertheless, when the reaction temperature further increased to 190 °C, the HMF yield slightly dropped to 46.35%. The yields of glucose and fructose were both lower than 1.5%, indicating a nearly complete conversion of the monosaccharides coming from cellulose hydrolysis. Little LA and FA were formed (<2%) due to the impeded secondary reactions involving HMF in the presence of DMOE. The generation trend of LA with rising temperature coincided with that of HMF, and its yield reached a maximum value at 180 °C. At higher reaction temperatures LA and HMF could become much more reactive to undergo side reactions (i.e., condensation), which might be the cause of the fluctuant tendency of HMF and LA in Fig. 2a. The yield of FA at different temperatures followed the same tendency as that of LA. As for the monosaccharides, the glucose yield showed a decline with increasing temperature, while the yield of fructose remained almost unchanged. The product distribution from cellulose at different reaction time was depicted in Fig. 2b. It was obvious that the generation of HMF, LA and FA followed an increasing tendency with the reaction time going by, and both of them reached the peak values at 120 min. After 120 min the yield of HMF began to fall because HMF was easily rehydrated to form byproducts like formic acid and humins.39 Similarly, LA and FA could also undergo some side reactions (fragmentation and polymerization) in acidic reaction conditions.40 The yields of glucose and fructose were below 0.5% and showed a slow fluctuation with the highest yields achieved at 90 min.
Fig. 2. Effect of reaction temperature (a) and time (b) on the product distribution from cellulose conversion (DMOE–water (7 : 1), 120 min (a), 180 °C (b), 0.02 M AlCl3, 0.02 M H3PO4, 36 mg mL−1 cellulose).
3.3. Effect of Lewis acid and Brønsted acid on liquid-phase product
After cellulose was hydrolyzed to form glucose, the synergistic catalytic effect between Lewis acid and Brønsted acid is required for an efficient production of HMF from glucose, as shown in Fig. 3.
Fig. 3. Transformation of cellulose to HMF catalyzed by Lewis acid and Brønsted acid.
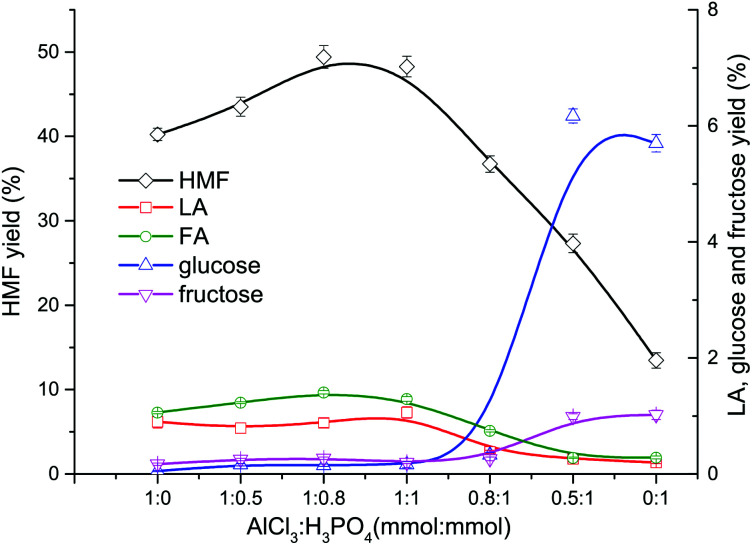
In the conversion process of cellulose, the synergistic catalytic effect between Lewis acid and Brønsted acid is required for an efficient production of HMF. The product distribution from cellulose conversion with different Lewis acid (AlCl3)–Brønsted acid (H3PO4) ratios is presented in Fig. 4. When only AlCl3 was added, the HMF yield reached up to 40.24%, indicating that AlCl3 had good catalytic performance on the HMF production from cellulose in the proposed water–DMOE solvent system. After H3PO4 was gradually added to the solution, the HMF yield showed an ascent at first, and it arrived at the highest value of 49.42% when the AlCl3–H3PO4 mole ratio was 1 : 0.8. The main reason was that H3PO4 could promote the hydrolysis process of cellulose to generate monosaccharide (glucose). In this way, the following isomerization reaction of glucose catalyzed by AlCl3 would be facilitated. When the AlCl3–H3PO4 mole ratio decreased to 1 : 1, the HMF yield dropped slightly to 48.27%. Noticeably, as the proportion of AlCl3 further declined, the HMF yield fell considerably to 36.73%, 27.33% and 13.46% at the AlCl3–H3PO4 ratio of 0.8 : 1, 0.5 : 1 and 0.1 : 1, respectively. It could be concluded that H3PO4 had few catalytic effects on the formation of HMF, because H3PO4 mainly behaved as a Brønsted acid to provide hydrogen ions for the hydrolysis and dehydration reactions. Although PO43− could be recognized as a conjugate base and facilitate the isomerization reaction of glucose to generate fructose, its Lewis acidity was actually much lower than AlCl3, leading to decreased HMF yield without the presence of AlCl3. Yin et al. also reported unsatisfactory HMF yield of 20.72% from cellulose with only a Brønsted acidic catalyst (hydrochloric acid).41 Consequently, for the purpose of high-efficiency production of HMF from cellulose, the Lewis acid–Brønsted acid ratio needed to be optimized to take full advantage of their synergistic effect.
Fig. 4. Effect of AlCl3–H3PO4 mole ratio on the product distribution from cellulose conversion (DMOE–water (7 : 1), 180 °C, 120 min, 36 mg mL−1 cellulose).
As for the formation of LA and FA, it can be seen from Fig. 4 that the yields of LA and FA were both around 1% when the AlCl3 concentration was not less than H3PO4. As the share of AlCl3 decreased, the yields of LA and FA also dropped slowly, which could be attributed to the lower HMF yield in the presence of excess H3PO4.
Obviously, the yields of glucose and fructose were pretty low (<0.5%) when the AlCl3–H3PO4 mole ratio was higher than 1 : 1, and at these ratios fructose was always more than glucose. This suggested that most of the glucose formed from cellulose hydrolyzation was converted into fructose with Lewis acidic AlCl3 as the catalyst, and then the fructose was dehydrated to generate HMF. As the AlCl3–H3PO4 mole ratio decrease to 0.5 : 1, the yields of glucose and fructose rose significantly to 6.17% and 1.02%, respectively, resulting in much more unreacted glucose caused by insufficient AlCl3. When no AlCl3 existed, the yields of glucose and fructose reached 5.70% and 0.99%, respectively, and the corresponding HMF yield was as low as 13.46%. The decreased yield of glucose from 6.17% to 5.70% could be explained by the enhanced dehydration reaction towards anhydrosugars when catalyzed solely by H3PO4, which was evidenced by the following GC-MS analysis. Besides, glucose might also undergo a variety of acid-catalyzed side reactions to generate undesired products such as humins, which led to its consumption.26
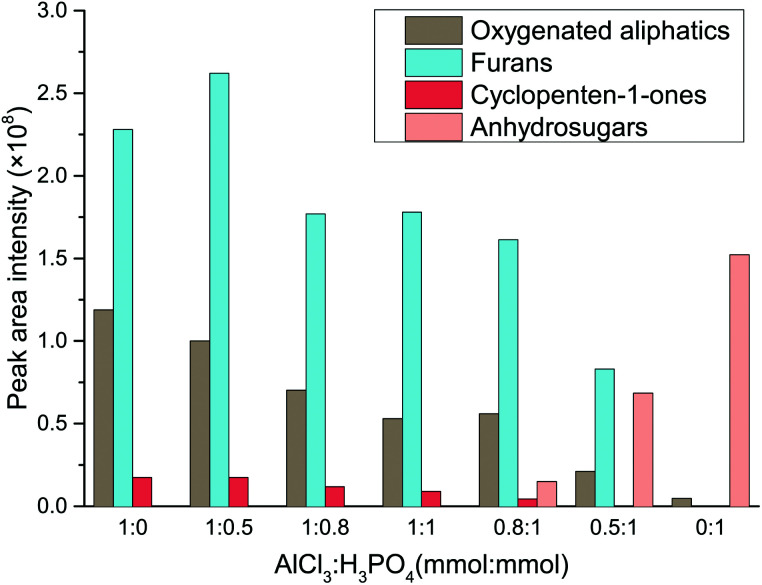
In order to provide a deeper insight into the catalytic mechanism of Lewis acid and Brønsted in the water–DMOE solvent system, typical product distribution in the liquid phase at different AlCl3–H3PO4 mole ratio was analyzed by GC-MS. The products formed from the catalytic conversion of cellulose were mainly divided into four categories, namely oxygenated aliphatics, furans, cyclopenten-1-ones and anhydrosugars. The distribution variation of these chemical families at different AlCl3–H3PO4 mole ratios is shown in Fig. 5.
Fig. 5. Effect of AlCl3–H3PO4 mole ratio on the product distribution of chemical families from cellulose conversion (HMF, LA, glucose and fructose are not depicted).
As for the oxygenated aliphatics, besides LA and formic acid, they mainly consisted of hydroxyacetones and hydroxybutanones, which came from the retroaldolization of the intermediates or the fragmentation of acyclic intermediates.42–44 As the AlCl3–H3PO4 mole ratio decreased, the generation of oxygenated aliphatics was inhibited, suggesting a more profound effect of Lewis acid on the breakage of the carbon chain. Furans were the primary products from cellulose degradation, and they covered a wide range of species including HMF, furfural, 5-methylfurfural, 2,5-diformylfuran, furfuryl alcohol and 5-acetoxymethyl-2-furaldehyde. This chemical family was mainly generated by the dehydration reaction of furanose or the rearrangement of acyclic fragments coming from monosaccharide retroaldolization. In general, it was easy for furans to be formed in the presence of Lewis acid, whereas they presented a lower yield with Brønsted acid as the catalyst. It could be inferred that reaction conditions containing sufficient Lewis acid would promote the generation of furanose, and therefore the formation of furan products was greatly facilitated.
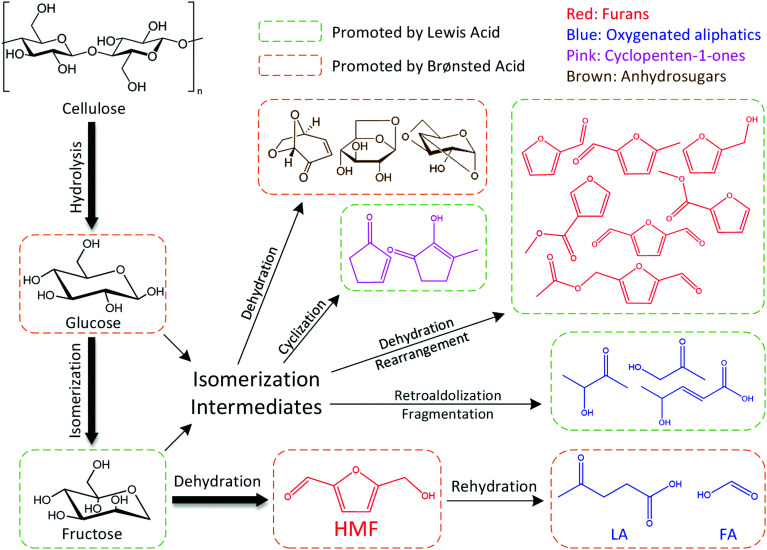
The dominant species of cyclopenten-1-ones were 2-cyclopenten-1-one and methyl cyclopentenolone. This kind of product with 5-carbon rings might have been produced by cyclization of chain intermediates containing multifunctional groups. Similar to the furans, the generation of cyclopenten-1-ones would be favored at high AlCl3–H3PO4 mole ratios, while they barely formed with single H3PO4 catalyst. The anhydrosugars mainly include levoglucosan, levoglucosenone, 1,4:3,6-dianhydro-d-glucopyranose and oligosaccharides. These sugars came from the Brønsted acid-catalyzed dehydration of monosaccharides to which cellulose was hydrolyzed. Hence a large amount of anhydrosugars were produced when the reaction was solely catalyzed by H3PO4, while their yields decreased sharply with the addition of AlCl3. Fig. 6 describes the reaction pathways involving the formation of liquid-phase products from cellulose. However, the related mechanisms are complex and further work is needed for clarification.
Fig. 6. Liquid-phase products formation pathways for cellulose conversion in water–DMOE solvent reaction system.
3.4. Effect of Lewis acid and Brønsted acid on insoluble humins
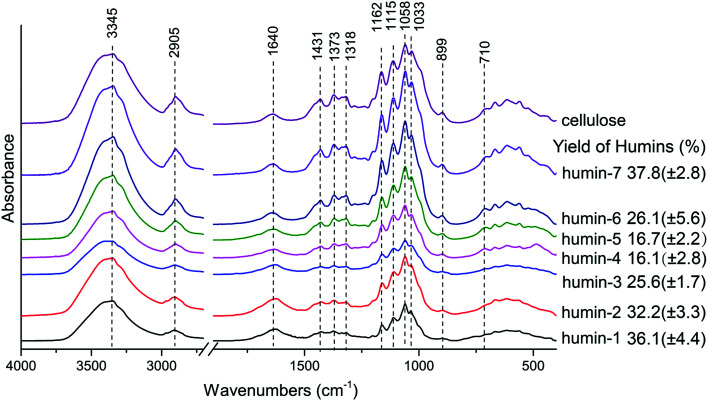
The mass of insoluble humins were measured. As shown in Fig. 7, it is obvious that the smallest amount of insoluble humins was obtained when the AlCl3–H3PO4 mole ratio was 1 : 1. Hence a combination of both Lewis acid and Brønsted acid is required in order to suppressing side reactions that led to humin formation. For the sake of further understanding the effects of catalysts on cellulose conversion when catalyzed by Lewis acid and Brønsted acid in water–DMOE solvent, the insoluble polymer humins were analyzed by FTIR. The FTIR spectra of the humins formed at different AlCl3–H3PO4 mole ratios are shown in Fig. 7. Humin 1–7 correspond to AlCl3–H3PO4 mole ratios at 1 : 0, 1 : 0.5, 1 : 0.8, 1 : 1, 0.8 : 1, 0.5 : 1, 0 : 1, respectively. It could be found that the humin structures at different catalyst ratios were similar to each other. The absorption peaks at 3345 cm−1 and 1318 cm−1 correspond to the stretching and bending of hydroxyl groups, respectively, which widely exist in cellulose structure; the peak at 2905 cm−1 is ascribed to C–H stretching, and this structure indicates the existence of methyl and methylene; the absorption at 1640 cm−1 can be attributed to the bond water in samples.45,46
Fig. 7. FTIR spectra and mass yields of insoluble humins formed at different AlCl3–H3PO4 mole ratios (humin 1–7 correspond to AlCl3–H3PO4 mole ratios at 1 : 0, 1 : 0.5, 1 : 0.8, 1 : 1, 0.8 : 1, 0.5 : 1, 0 : 1, respectively).
The peaks at 1431 cm−1 and 1220 cm−1 come from the bending and stretching of –CH2– structure in sugar rings, respectively; intensive and complex absorptions appear at 1200–1000 cm−1, and this range mainly correspond to the stretching of the glycosidic linkage (C–O–C) and C–OH in the sugar rings;45,47,48 the signal at 1162 cm−1 is from the C–O–C asymmetric bridge vibration in the β-glycosidic linkage of cellulose;49,50 the absorption at 899 cm−1 corresponds to the C1 group frequency or ring frequency, which is also characteristic of β-glycosidic linkages between the sugar units;51 the absorption band at 710 cm−1 is assigned to Iβ crystalline phase in cellulose.46 The above absorption peaks have similar characteristics, and they indicate the fundamental framework of polysaccharides remained in the humins. This might be explained by the lacking of water in the reaction system, leading to insufficient hydrolyzation of cellulose.
In addition, further analysis of the results revealed similarity between the FTIR spectra of cellulose and the humins obtained in H3PO4-rich conditions (i.e., humin-6 and humin-7), while the spectra of samples from AlCl3-rich conditions (i.e., humin-1, humin-2, humin-3) were different from the spectrum of original cellulose. Especially, the peak intensities of humins from AlCl3-rich conditions at low wavenumbers became much weaker than that of cellulose, which indicated that AlCl3 could destroy the original structure of cellulose to a higher degree than H3PO4. Similar results were also reported by Ma et al. They studied the effect of AlCl3 and HCl on cellulose conversion in high temperature liquid water, and AlCl3 was considered to have a more evident impact on the cellulose degradation.52 In our previous research, we used glucose as a model compound of cellulose to produce HMF in a similar reaction system of water–DMOE–AlCl3, and the obtained humins were mainly furan polymers from dehydration/condensation reactions of glucose, HMF and intermediates.26 Given that the majority of the humins from cellulose in the current work was polysaccharide, they could be recycled and reused in case of unnecessary waste.
4. Conclusion
This research focused on the catalytic effects of Lewis acid AlCl3 and Brønsted acid H3PO4 on the conversion process from cellulose to HMF. Firstly, the influence of solvent composition (water–DMOE ratio) on cellulose conversion catalyzed by both AlCl3 and H3PO4 was investigated. The results showed that cellulose tended to form LA in pure water solvent, while the yield of HMF significantly increased as the proportion of DMOE went up. In pure DMOE solvent, the reaction pathway of cellulose towards HMF was severely hindered. Consequently, cellulose could be selectively converted into HMF or LA by altering the solvent composition.
The conversion results of cellulose at different AlCl3–H3PO4 mole ratios were further analyzed. It was found that AlCl3-rich environment favored the formation of HMF, and the highest HMF yield 49.42% was achieved at an AlCl3–H3PO4 mole ratio of 1 : 0.8. In H3PO4-rich conditions, the generation of HMF was greatly inhibited and more glucose and fructose would be produced. Moreover, the liquid-phase products were analyzed by GC-MS, and they could be mainly separated into oxygenated aliphatics, furans, cyclopenten-1-ones and anhydrosugars. AlCl3 was able to facilitate the formation of furans and cyclopenten-1-ones, whereas more anhydrosugars would be produced in the presence of high H3PO4 content. FTIR analyses showed that some of the original polymer structures in cellulose were preserved in the insoluble humins, and high proportion of AlCl3 in catalysts could noticeably promote the cellulose degradation.
Conflicts of interest
The authors declare that they have no competing interests.
Supplementary Material
Acknowledgments
This work was supported by the National Science Fund for Distinguished Young Scholars (51725603), the National Natural Science Foundation of China (51476142), the National Science and Technology Supporting Plan Through Contract (2015BAD15B06), and the Program of Introducing Talents of Discipline to University (B08026).
References
- Wang S. Chen J. Cai Q. Zhang F. Wang Y. Ru B. Wang Q. Int. J. Hydrogen Energy. 2016;41:16385–16393. doi: 10.1016/j.ijhydene.2015.12.024. [DOI] [Google Scholar]
- Wang S. Dai G. Yang H. Luo Z. Prog. Energy Combust. Sci. 2017;62:33–86. doi: 10.1016/j.pecs.2017.05.004. [DOI] [Google Scholar]
- Bozell J. J. Petersen G. R. Green Chem. 2010;12:539–554. doi: 10.1039/B922014C. [DOI] [Google Scholar]
- Wang S. Zhao Y. Lin H. Chen J. Zhu L. Luo Z. Green Chem. 2017;19:3869–3879. doi: 10.1039/C7GC01298E. [DOI] [Google Scholar]
- Yang Y. Liu Q. Li D. Tan J. Zhang Q. Wang C. Ma L. RSC Adv. 2017;7:16311–16318. doi: 10.1039/C7RA00605E. [DOI] [Google Scholar]
- van Putten R.-J. van der Waal J. C. De Jong E. Rasrendra C. B. Heeres H. J. de Vries J. G. Chem. Rev. 2013;113:1499–1597. doi: 10.1021/cr300182k. [DOI] [PubMed] [Google Scholar]
- Alonso D. M. Bond J. Q. Dumesic J. A. Green Chem. 2010;12:1493–1513. doi: 10.1039/C004654J. [DOI] [Google Scholar]
- Isikgor F. H. Becer C. R. Polym. Chem. 2015;6:4497–4559. doi: 10.1039/C5PY00263J. [DOI] [Google Scholar]
- Wang S. Dai G. Ru B. Zhao Y. Wang X. Xiao G. Luo Z. Energy. 2017;120:864–871. doi: 10.1016/j.energy.2016.11.135. [DOI] [Google Scholar]
- Gallo J. M. R. Alonso D. M. Mellmer M. A. Dumesic J. A. Green Chem. 2013;15:85–90. doi: 10.1039/C2GC36536G. [DOI] [Google Scholar]
- Mukherjee A. Dumont M.-J. Raghavan V. Biomass Bioenergy. 2015;72:143–183. doi: 10.1016/j.biombioe.2014.11.007. [DOI] [Google Scholar]
- Dee S. J. Bell A. T. ChemSusChem. 2011;4:1166–1173. doi: 10.1002/cssc.201000426. [DOI] [PubMed] [Google Scholar]
- Choudhary V. Mushrif S. H. Ho C. Anderko A. Nikolakis V. Marinkovic N. S. Frenkel A. I. Sandler S. I. Vlachos D. G. J. Am. Chem. Soc. 2013;135:3997–4006. doi: 10.1021/ja3122763. [DOI] [PubMed] [Google Scholar]
- Kuster B., Starch-Stärke, 1990, vol. 42, pp. 314–321 [Google Scholar]
- Zhu Y. Zajicek J. Serianni A. S. J. Org. Chem. 2001;66:6244–6251. doi: 10.1021/jo010541m. [DOI] [PubMed] [Google Scholar]
- Lin H. Xiong Q. Zhao Y. Chen J. Wang S. AIChE J. 2017;63:257–265. doi: 10.1002/aic.15550. [DOI] [Google Scholar]
- Lin H. Chen J. Zhao Y. Wang S. Energy Fuels. 2017;31:3929–3934. doi: 10.1021/acs.energyfuels.6b01975. [DOI] [Google Scholar]
- Acharjee T. C. Lee Y. Y. Environ. Prog. Sustainable Energy. 2018;37:471–480. doi: 10.1002/ep.12659. [DOI] [Google Scholar]
- Zhang T. Fan W. Li W. Xu Z. Xin H. Su M. Lu Y. Ma L. Energy Technol. 2017;5:747–755. doi: 10.1002/ente.201600492. [DOI] [Google Scholar]
- Weiqi W. Shubin W. Chem. Eng. J. 2017;307:389–398. doi: 10.1016/j.cej.2016.08.099. [DOI] [Google Scholar]
- Wang C. Zhang L. Zhou T. Chen J. Xu F. Sci. Rep. 2017;7:40908. doi: 10.1038/srep40908. [DOI] [PMC free article] [PubMed] [Google Scholar]
- Zhang X. Murria P. Jiang Y. Xiao W. Kenttämaa H. I. Abu-Omar M. M. Mosier N. S. Green Chem. 2016;18:5219–5229. doi: 10.1039/C6GC01395C. [DOI] [Google Scholar]
- Wong M. Bradshaw A. New Phytol. 1982;91:255–261. doi: 10.1111/j.1469-8137.1982.tb03310.x. [DOI] [Google Scholar]
- Li C. Wang Q. Zhao Z. K. Green Chem. 2008;10:177–182. doi: 10.1039/B711512A. [DOI] [Google Scholar]
- Teong S. P. Yi G. Zhang Y. Green Chem. 2014;16:2015–2026. doi: 10.1039/C3GC42018C. [DOI] [Google Scholar]
- Wang S. Lin H. Chen J. Zhao Y. Ru B. Qiu K. Zhou J. RSC Adv. 2015;5:84014–84021. doi: 10.1039/C5RA18824E. [DOI] [Google Scholar]
- Pagan-Torres Y. J. Wang T. Gallo J. M. R. Shanks B. H. Dumesic J. A. ACS Catal. 2012;2:930–934. doi: 10.1021/cs300192z. [DOI] [Google Scholar]
- Dutta A. Gupta D. Patra A. K. Saha B. Bhaumik A. ChemSusChem. 2014;7:925–933. doi: 10.1002/cssc.201300766. [DOI] [PubMed] [Google Scholar]
- Wang J. Ren J. Liu X. Xi J. Xia Q. Zu Y. Lu G. Wang Y. Green Chem. 2012;14:2506–2512. doi: 10.1039/C2GC35699F. [DOI] [Google Scholar]
- Weingarten R. Rodriguez-Beuerman A. Cao F. Luterbacher J. S. Alonso D. M. Dumesic J. A. Huber G. W. ChemCatChem. 2014;6:2229–2234. doi: 10.1002/cctc.201402299. [DOI] [Google Scholar]
- Shi N. Liu Q. Zhang Q. Wang T. Ma L. Green Chem. 2013;15:1967–1974. doi: 10.1039/C3GC40667A. [DOI] [Google Scholar]
- Zhou L. Liang R. Ma Z. Wu T. Wu Y. Bioresour. Technol. 2013;129:450–455. doi: 10.1016/j.biortech.2012.11.015. [DOI] [PubMed] [Google Scholar]
- Kim B. Antonyraj C. A. Kim Y. J. Kim B. Shin S. Kim S. Lee K.-Y. Cho J. K. Ind. Eng. Chem. Res. 2014;53:4633–4641. doi: 10.1021/ie500303e. [DOI] [Google Scholar]
- Wang T. Nolte M. W. Shanks B. H. Green Chem. 2014;16:548–572. doi: 10.1039/C3GC41365A. [DOI] [Google Scholar]
- Karwa S. Gajiwala V. M. Heltzel J. Patil S. K. Lund C. R. Catal. Today. 2016;263:16–21. doi: 10.1016/j.cattod.2015.06.020. [DOI] [Google Scholar]
- Asghari F. S. Yoshida H. Ind. Eng. Chem. Res. 2007;46:7703–7710. doi: 10.1021/ie061673e. [DOI] [Google Scholar]
- Yang F. Fu J. Mo J. Lu X. Energy Fuels. 2013;27:6973–6978. doi: 10.1021/ef401560v. [DOI] [Google Scholar]
- Nemoto K. Tominaga K.-i. Sato K. Bull. Chem. Soc. Jpn. 2015;88:1752–1754. doi: 10.1246/bcsj.20150266. [DOI] [Google Scholar]
- Kuster B. F. Carbohydr. Res. 1977;54:177–183. doi: 10.1016/S0008-6215(00)84807-7. [DOI] [Google Scholar]
- Ya'aini N. Amin N. A. S. Endud S. Microporous Mesoporous Mater. 2013;171:14–23. doi: 10.1016/j.micromeso.2013.01.002. [DOI] [Google Scholar]
- Yin S. Pan Y. Tan Z. Int. J. Green Energy. 2011;8:234–247. doi: 10.1080/15435075.2010.548888. [DOI] [Google Scholar]
- Dutta S. De S. Saha B. Biomass Bioenergy. 2013;55:355–369. doi: 10.1016/j.biombioe.2013.02.008. [DOI] [Google Scholar]
- Fusaro M. B. Chagnault V. Postel D. Carbohydr. Res. 2015;409:9–19. doi: 10.1016/j.carres.2015.03.012. [DOI] [PubMed] [Google Scholar]
- Yu Y. Wu H. Ind. Eng. Chem. Res. 2011;50:10500–10508. doi: 10.1021/ie2011388. [DOI] [Google Scholar]
- Kačuráková M. Belton P. S. Wilson R. H. Hirsch J. Ebringerová A. J. Sci. Food Agric. 1998;77:38–44. doi: 10.1002/(SICI)1097-0010(199805)77:1<38::AID-JSFA999>3.0.CO;2-5. [DOI] [Google Scholar]
- Liu R. Yu H. Huang Y. Cellulose. 2005;12:25–34. doi: 10.1023/B:CELL.0000049346.28276.95. [DOI] [Google Scholar]
- Kacurakova M. Capek P. Sasinkova V. Wellner N. Ebringerova A. Carbohydr. Polym. 2000;43:195–203. doi: 10.1016/S0144-8617(00)00151-X. [DOI] [Google Scholar]
- Sun X.-F. Sun R. Fowler P. Baird M. S. J. Agric. Food Chem. 2005;53:860–870. doi: 10.1021/jf040456q. [DOI] [PubMed] [Google Scholar]
- Bian J. Peng F. Peng X.-P. Xiao X. Peng P. Xu F. Sun R.-C. Carbohydr. Polym. 2014;100:211–217. doi: 10.1016/j.carbpol.2013.02.059. [DOI] [PubMed] [Google Scholar]
- Široký J. Blackburn R. S. Bechtold T. Taylor J. White P. Cellulose. 2010;17:103–115. doi: 10.1007/s10570-009-9378-x. [DOI] [Google Scholar]
- Fang J. Sun R. Tomkinson J. Cellulose. 2000;7:87–107. doi: 10.1023/A:1009245100275. [DOI] [Google Scholar]
- Ma Y. Ji W. Zhu X. Tian L. Wan X. Biomass Bioenergy. 2012;39:106–111. doi: 10.1016/j.biombioe.2011.12.033. [DOI] [Google Scholar]


