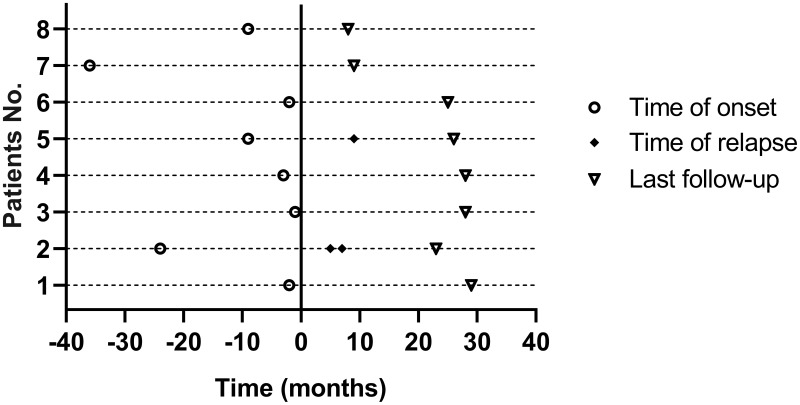
Figure 5.
Time of disease onset, time of clinical relapse and last follow-up visit are displayed. The vertical line at 0 crossing the x-axis indicates the initiation of low-dose RTX treatment. ○indicates time of disease onset. ◆indicates times from the first RTX infusion to clinical relapse. ▽indicates times from the first RTX infusion to last follow-up visit.
Abbreviation: RTX, rituximab.

