An official website of the United States government
Here's how you know
Official websites use .gov
A
.gov website belongs to an official
government organization in the United States.
Secure .gov websites use HTTPS
A lock (
) or https:// means you've safely
connected to the .gov website. Share sensitive
information only on official, secure websites.
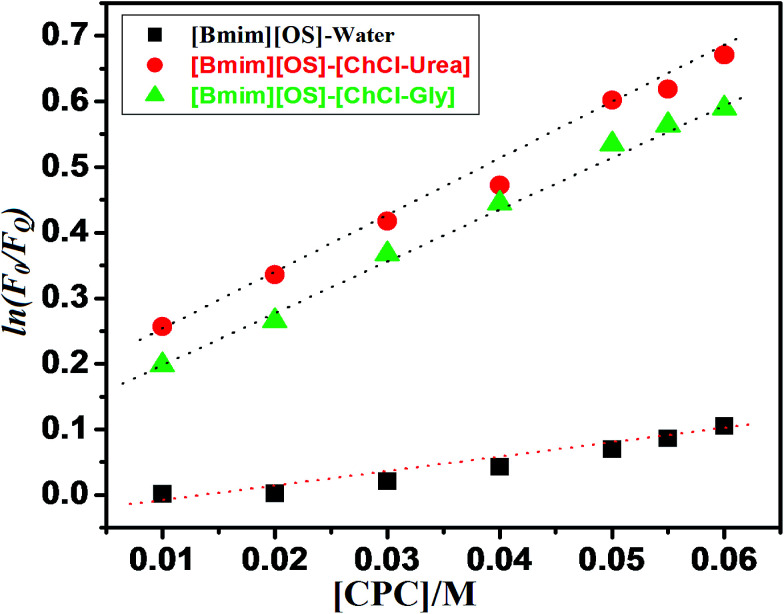
 [Bmim][OS]–water,
  [Bmim][OS]–[ChCl–Gly] and
  [Bmim][OS]–[ChCl–urea]. Solid lines represent the result of the linear regression analysis.