. 2018 Feb 19;8(14):7818–7831. doi: 10.1039/c7ra11872d

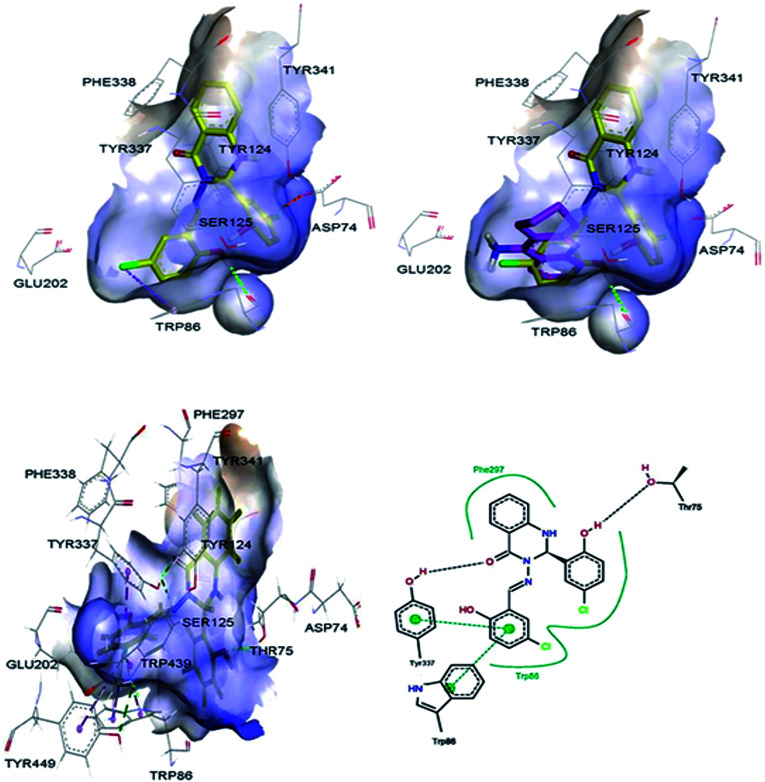
Fig. 4. 3D representations of the binding pose of compound 2 (yellow) and tacrine (pink) in complex with human AChE (PDB ID: 4EY7) from docking (up) and final MD (bottom). The hydrophobic surfaces of the interacting residues are shown in blue. Ligand–protein interactions are depicted with dotted lines: hydrogen bonds (green), π–anion interactions (orange), π–halogen interactions (purple). Schematic representation of the binding interaction of compound 2 at final MD with PoseView is in bottom, right. Hydrogen bonds and π–π stacking interactions are depicted with black and green dotted lines, respectively. The green curve represents other non-polar interactions.

Fig. 4