. 2018 Feb 28;8(16):8910–8919. doi: 10.1039/c7ra13742g

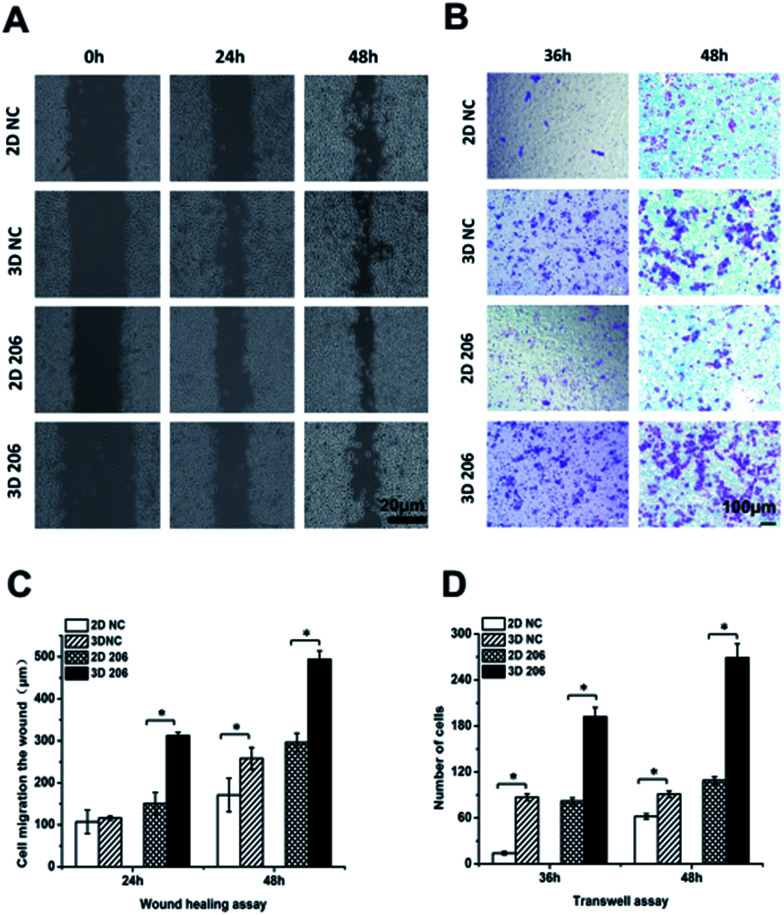
Fig. 4. Comparison of cell migration and metastasis activity in OvCa cells in different cultures. The migration rates of OV-NC and OV-206 cells in different groups were compared by the wound healing assay (A). Microscopic observation was recorded at 0, 24 and 48 h after scratching the cell layer. Graph showing the distance of migration for these two types of cells in different culture groups (C). Invasive ability of OvCa cells was assessed by Matrigel invasion assay (B). The graph of invasion cells at 36 and 48 h in different groups (D). Each bar represents the cell numbers adherent to the lower membrane. Values are expressed as the mean ± SD of three replicates. *P < 0.05. n = 3 independent experiments.

Fig. 4