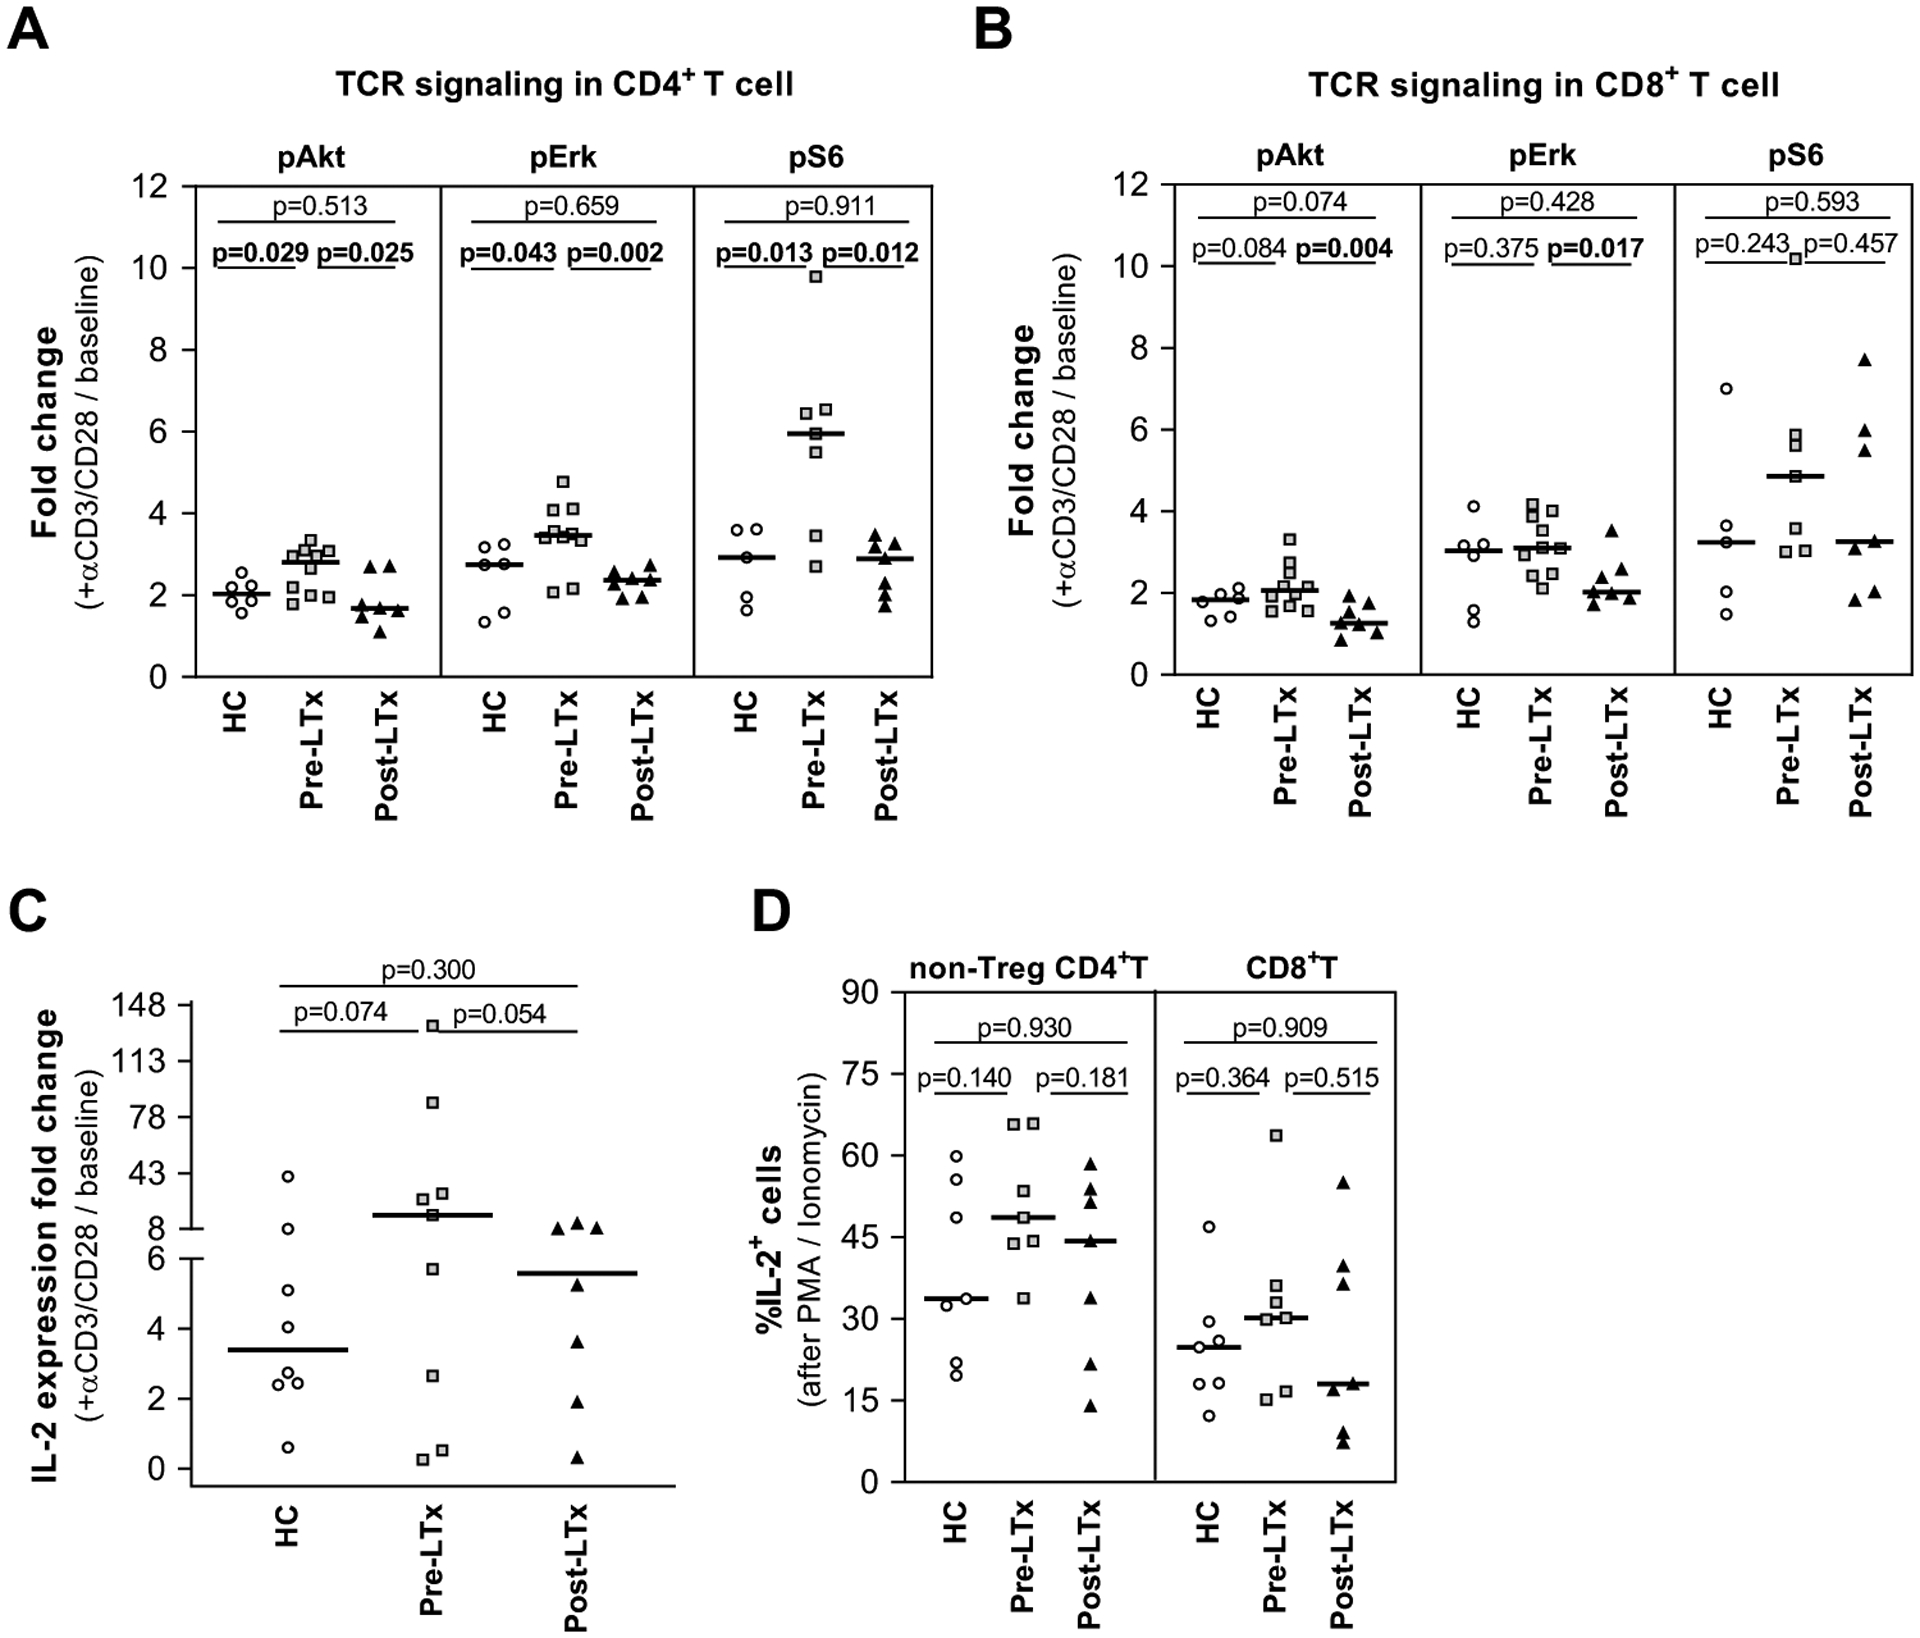
Figure 2. T cell receptor signaling, and IL-2 production are preserved in PBMC from pre- and post-LTx patients.

(A-C) PBMC were stimulated with anti-CD3/CD28 antibodies for 6h. (A-B) The integrity of TCR signaling was studied using phospho-flow cytometry to assess phosphorylated Akt, Erk, and S6 signaling molecules, in (A) CD4+ and (B) CD8+ T cells. In all cases, HC and post-LTx cells generated similar results whereas values in pre-LTx were consistently higher in CD4+, but not CD8+, pre-LTx cells. Values represent the fold change to baseline of each stimulated responder (HC=6, pre-LTx=10, post-LTx=7). (C) IL-2 production was evaluated using real time PCR. The IL-2 fold change vs unstimulated cells demonstrated similar results for all groups, with a trend to greater increase in pre-LTx (HC=8, pre-LTx=9, post-LTx=7). (D) PBMC stimulated for 4–6h with PMA/Ionomycin were analyzed by flow cytometry to determine the frequency of IL-2+ in non-Treg CD4+ and CD8+T cells. Results were equivalent in all groups (n=7/group).
Results represent the median. P-values were calculated using unpaired t-test with Welch’s correction. Significant p-values are highlighted in bold. HC: healthy controls; PBMC: peripheral blood mononuclear cells; TCR: T cell receptor; LTx: liver transplant.
