. 2018 Mar 2;8(17):9223–9231. doi: 10.1039/c7ra12347g

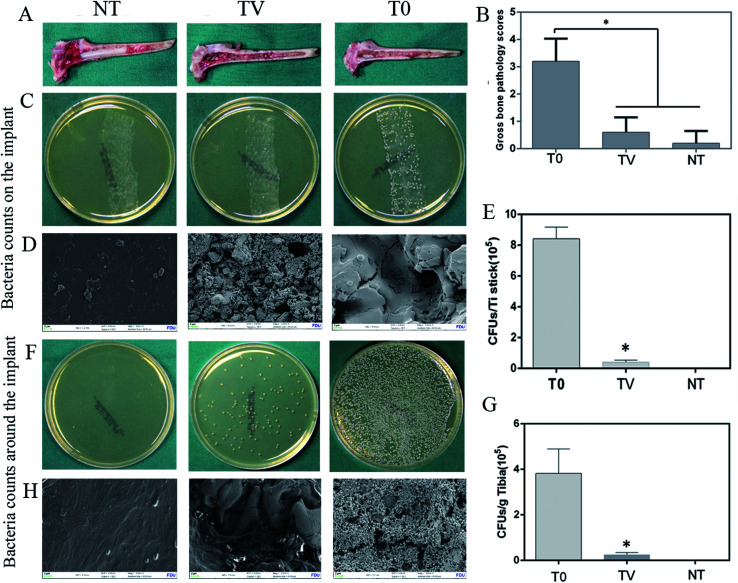
Fig. 4. Bacterial culture and quantitative analysis of Ti-coated column implants in three groups at 6 weeks: (A) gross appearance (B) gross score (C) TSA plate culture results; (D) SEM to characterize the bacteria on various Ti implants; (E) quantitative results of adherent bacteria on various Ti implants; (F) TSA plate culture results of the bacteria of the bone tissue around the implant; (G) quantitation of bacteria per gram of rabbit tibial bone tissue; (H) SEM to characterize the bacteria on various bone tissues around the Ti implant. TV and T0 were significantly different (*p < 0.05); blank control group without bacterial growth.

Fig. 4