. 2018 Mar 8;8(18):9910–9921. doi: 10.1039/c8ra00351c

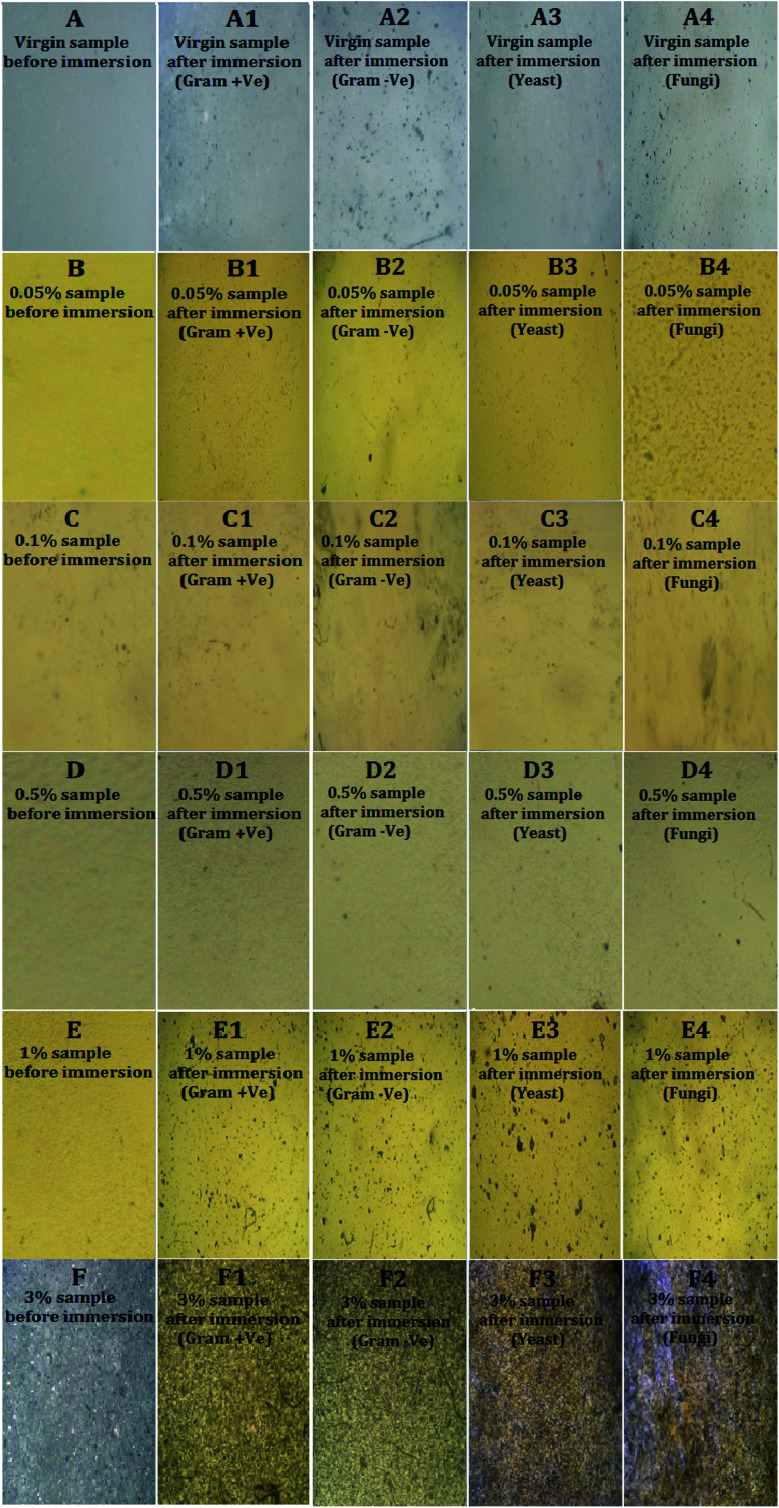
Fig. 9. POM captures where (A), (A1), (A2), (A3) and (A4) of the virgin PDMS; (B), (B1), (B2), (B3) and (B4) of the as-synthesized PDMS/Ag@SiO2 core–shell nanocomposites (with 0.05% nanofiller loadings); (C), (C1), (C2), (C3) and (C4) are the images of the PDMS/Ag@SiO2 core–shell nanocomposites (with 0.1% nanofiller loadings); (D), (D1), (D2), (D3) and (D4) corresponding to the as-synthesized PDMS/Ag@SiO2 core–shell nanocomposites (with 0.5% nanofiller loadings); (E), (E1), (E2), (E3)and (E4) of the prepared PDMS/Ag@SiO2 core–shell nanocomposites (with 1% nanofiller loadings) and (F), (F1), (F2), (F3) and (F4) of the as-synthesized PDMS/Ag@SiO2 core–shell nanocomposites (with 3% nanofiller loadings) all before and after immersion in Gram (+ve and −ve) bacteria, yeast and fungi organisms for one month.

Fig. 9