
Figure 2.
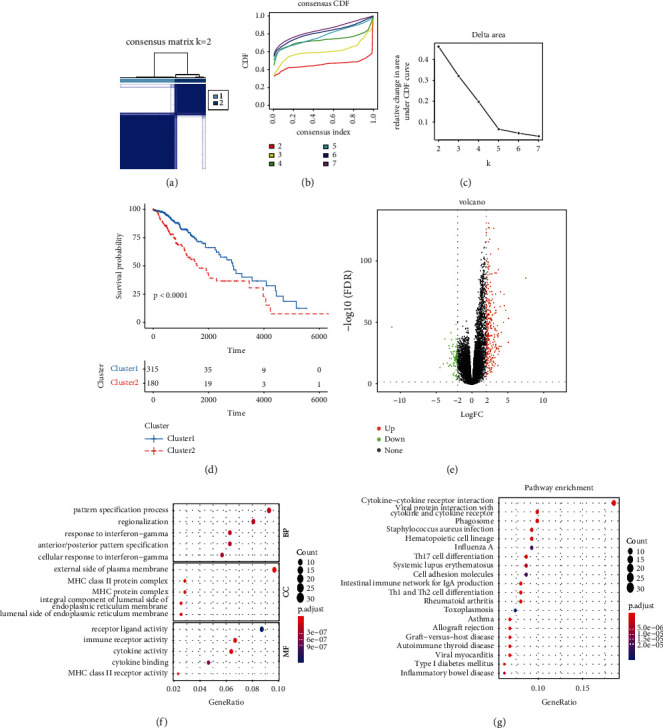
Identification and characteristics of PRS. (a) Consensus matrix heatmap of two subtypes (k = 2). (b) The correlation between CDF and consensus index under consensus CDF curve when k = 2–7. (c) The relative change in area under the CDF curve when k = 2–7. (d) Kaplan-Meier survival analysis of OS between Cluster1 and Cluster2. (e) The volcano plot of differentially expressed PRS genes. (f) GO enrichment analysis of differentially expressed PRS genes. (g) KEGG pathway enrichment analysis of differentially expressed PRS genes. BP, biology process; CC, cellular component; MF, molecular function.