
Figure 3.
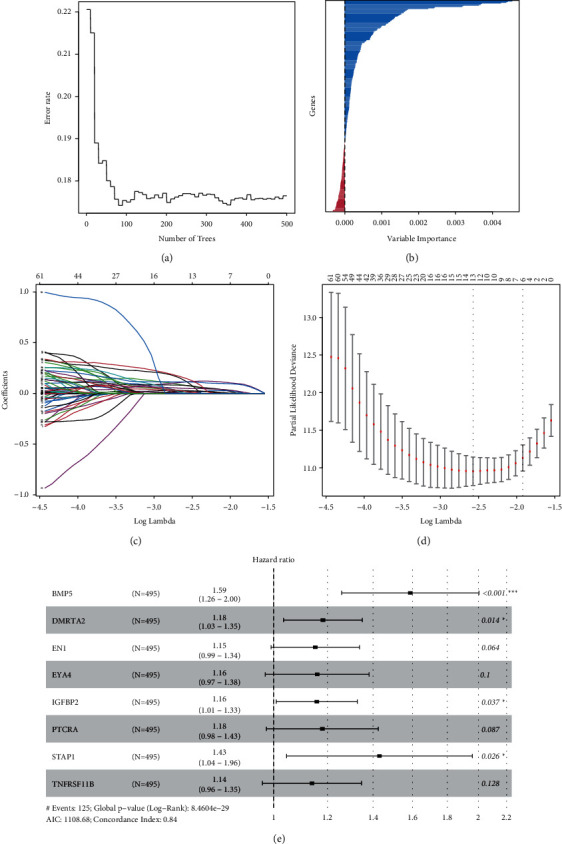
The construction of PRS gene signature. (a) The change of error rate with the number of trees in the RSF model. (b) The relative importance score distribution of PRS genes in the RSF model. (c) LASSO coefficient profiles of the 204 prognostic PRS genes. (d) Partial likelihood deviance of genes revealed by LASSO. (e) Forest plot of each gene in eight-gene PRS signature after stepwise multivariate Cox regression analysis.