
Figure 4.
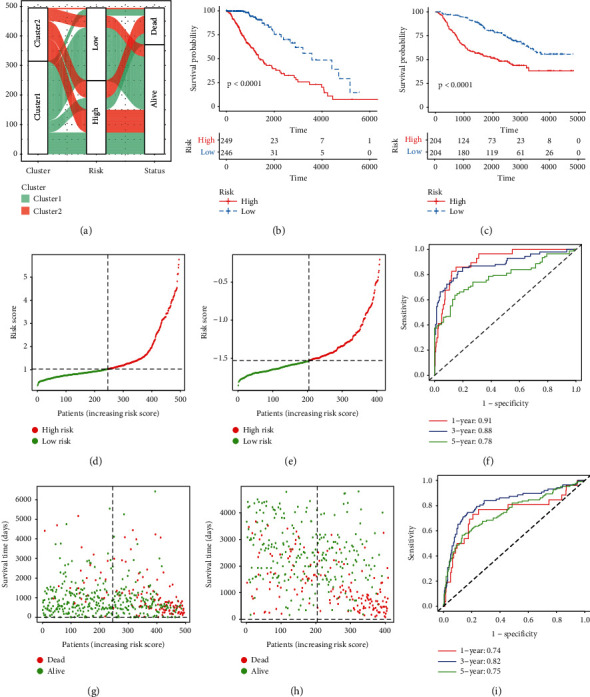
The validation of an eight-gene PRS signature. (a) Alluvial diagram of different subtypes with different risk scores and survival outcomes. (b) Kaplan-Meier survival curves of OS between the high-risk group and low-risk group in TCGA. (c) Kaplan-Meier survival curves of OS between the high-risk group and low-risk group in CGGA. (d) The distribution of risk scores in TCGA. (e) The distribution of risk scores in CGGA. (f) The time-dependent ROC curves of 1-, 3-, and 5-year in TCGA. (g) The relationship between survival status, survival time, and risk score in TCGA. (h) The relationship between survival status, survival time, and risk score in CGGA. (i) The time-dependent ROC curves of 1-, 3-, and 5-year in CGGA.