
Figure 6.
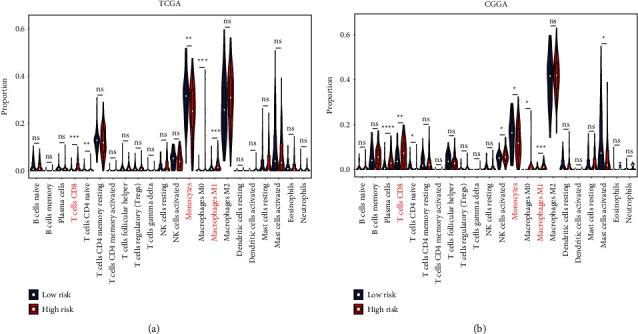
The relationship between tumor-infiltrating immune cells and PRS gene signature. (a) The proportion of tumor-infiltrating immune cells between the low-risk group and high-risk group in TCGA. (b) The proportion of tumor-infiltrating immune cells between the low-risk group and high-risk group in CGGA. Data in (a-b) were analyzed by Wilcoxon test; ns, no significance; ∗p < 0.05, ∗∗p < 0.01, and ∗∗∗p < 0.001.