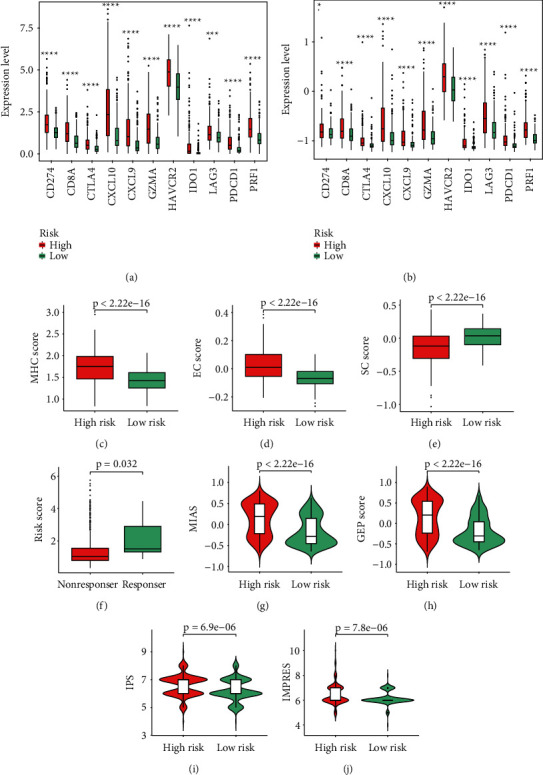
Figure 9.

LGG patients' response to ICIs and PRS gene signature. (a) The expressions of 11 ICs between the low-risk group and high-risk group in TCGA. (b) The expressions of 11 ICs between the low-risk group and high-risk group in CGGA. (c-e) The MHC score, EC score, and SC score between the low-risk group and high-risk group. (f) Risk score in LGG patients with a different ICI response status. (g-j) The MIAS, GEP score, IPS, and IMPRES between the low-risk group and high-risk group. Data in (a-b) were analyzed by Wilcoxon test; ∗p < 0.05, ∗∗p < 0.01, ∗∗∗p < 0.001, and ∗∗∗∗p < 0.0001.
