
Figure 3.
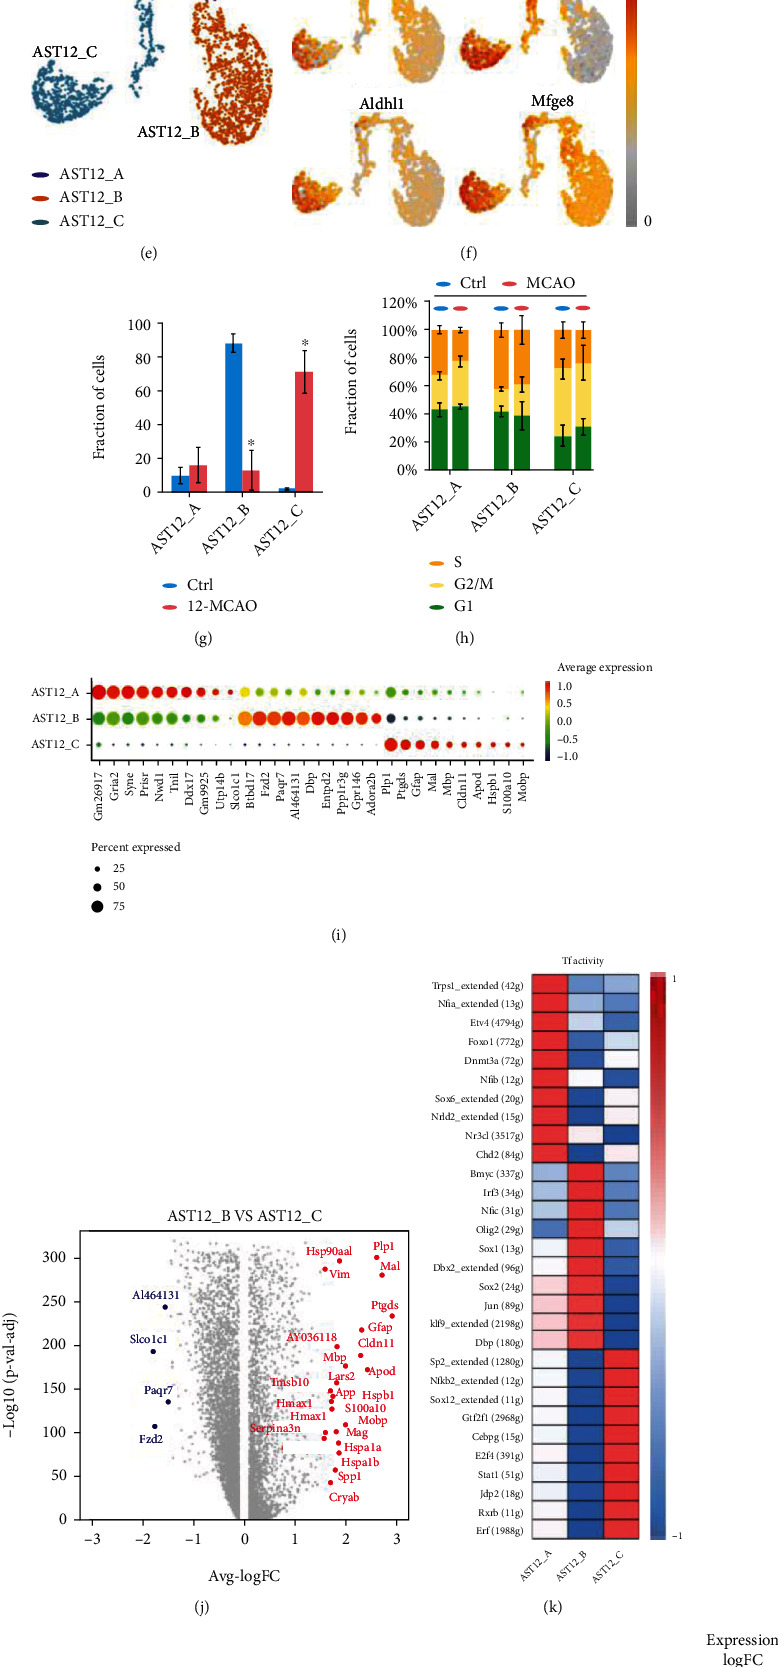
Astrocyte heterogeneities in the 12 h-tMCAO-system. (a). Unsupervised clustering of astrocytes visualized by sample distribution. (b). Visualization of the expression of signature genes of astrocytes. (c). Subpopulation of astrocytes using monocle algorithm visualized by sample distribution. (d). The t-SNE plot for cell differentiation trajectory. (e). Identified subpopulation of astrocytes clustered by monocle algorithm. (f). Visualization of the expression of previously reported signature genes of astrocytes in the t-SNE plot clustered by monocle algorithm. (g). The proportion of cells that contributed to each cluster by control and MCAO. (h). The cell cycle distribution in the three subpopulations. (i). Bubble plots displayed the top 10 signature genes for each subpopulation. (j). Volcano plot to identify the differential genes between AST12_B and AST12_C. (k). Heatmap of the expression regulation by transcription factors of the identified clusters. (l). Gene ontology network based on genes that are highly upregulated.