Figure 5.
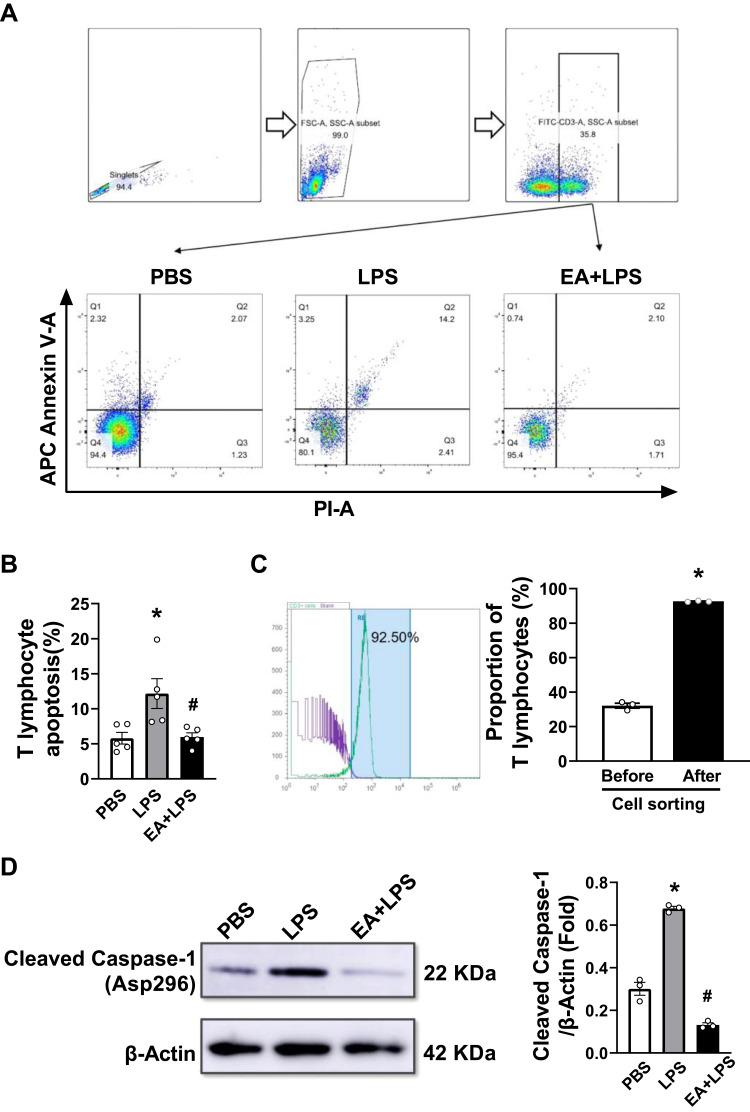
Analyses of apoptosis and pyrolysis by flow cytometry and Western-blots. (A) Annexin V and propidium iodide (PI) markers were used to identify apoptotic T lymphocytes in spleen cells. The cells in the upper right quadrant were the apoptotic cells. The flow cytometry circle gate strategy was shown in the figure. (B) The percentage of apoptosis of mouse splenic T lymphocytes of the three groups (n = 5/group, *P < 0.05, compared to PBS control mice; #P < 0.05, compared to endotoxemic mice.) (C) T lymphocytes were labeled with FITC anti-mouse CD3 and sorted with immunomagnetic beads. Diagram of flow cytometry shows the proportion of T lymphocytes after separation. Purity of T lymphocyte after sorting was 92.7 ± 0.2% (n = 3/group, *P < 0.05, compared to before cell sorting.) (D) Western blot data showed the expression of protein cleaved caspase-1 in each group. β-actin was set as the loading control. (n = 3/group, *P < 0.05, compared to PBS control mice; #P < 0.05, compared to endotoxemic mice).

