. 2018 Mar 16;8(19):10620–10626. doi: 10.1039/c8ra00401c

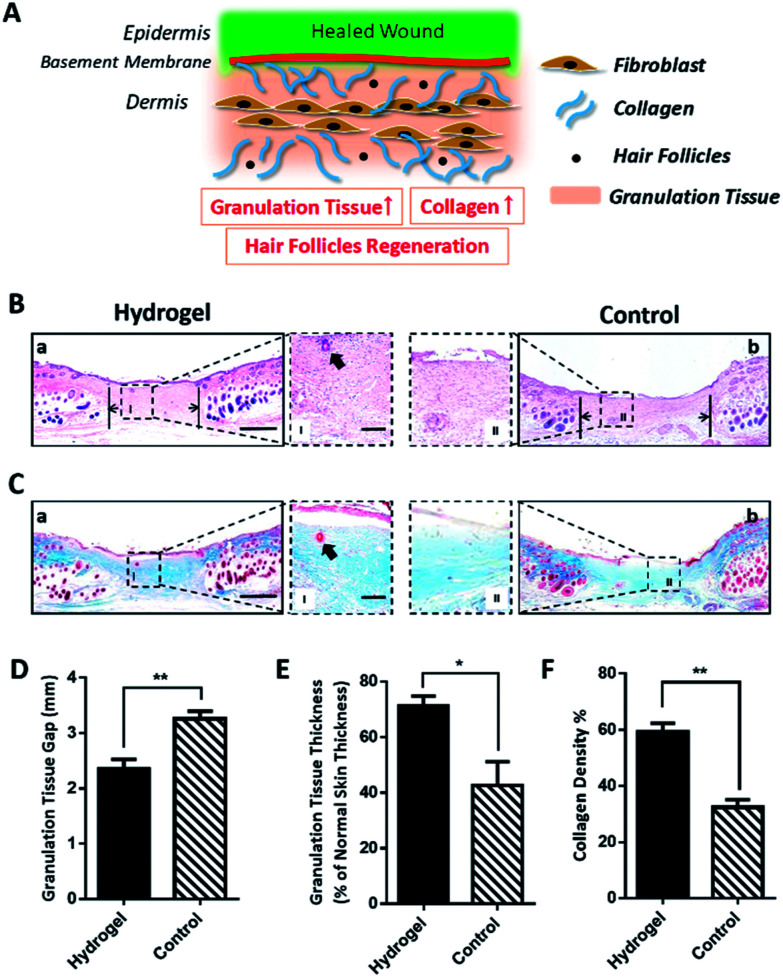
Fig. 3. Copolypeptide hydrogel enhances skin maturation and functionalization in a microscopic scale. (A) Schematic diagram of granulation tissue and collagen deposition. (B) H&E staining on day 20 after treatment of hydrogel and saline (control). The granulation tissue areas I and II are magnified. The arrows in (a) and (b) indicated the granulation tissue gap. The black arrow in the magnified image I represented the newly regenerated hair follicles after hydrogel treatment. The scale bar in (a) and (b) is 1 mm, and in magnified images I and II is 100 μm. (C) MT staining on day 20. The blue color indicates the distribution of the collagen. Area I and II in (a) and (b) are magnified. The black arrow in the magnified image represents new hair follicles generated after hydrogel treatment. The scale bar in (a) and (b) is 1 mm, and in magnified images I and II is 100 μm. (D) Quantified granulation tissue gap on day 20. (E) Percentage of granulation tissue thickness of normal skin thickness on day 20. (F) Quantified collagen density on day 20. Statistical differences were performed using one-way analysis of variance (ANOVA). **P < 0.01, *P < 0.05, compared to the control group, n > 3.

Fig. 3