. 2018 Mar 20;8(20):10975–10979. doi: 10.1039/c8ra01185k

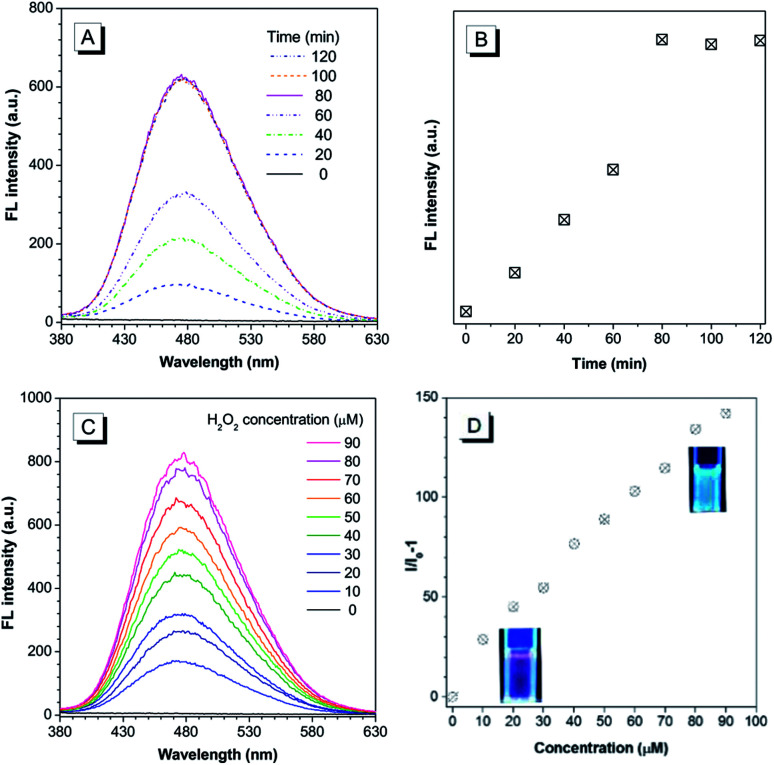
Fig. 1. (A) Changes in fluorescence (FL) spectra of the ABD-system (10 μM) in PBS buffer solution in the presence of H2O2 (100 μM) for different times (0 to 90 min). (B) Plot of FL intensity versus incubation time. The data are extracted from the spectra in (A). (C) FL spectra of the ABD-system in PBS buffer solution incubated with different concentrations of H2O2 for 90 min; (D) plot of the relative FL intensity versus H2O2 concentration. The data are extracted from (C), and the inset photographs show the FL images of the stock solutions with and without H2O2. Concentration of the ABD-system (10 μM); PBS buffer solution (pH = 7.8, 10 mM, containing 1% DMSO); temperature: 37 °C; excitation wavelength: 330 nm for FL measurement and 365 nm for photograph.

Fig. 1