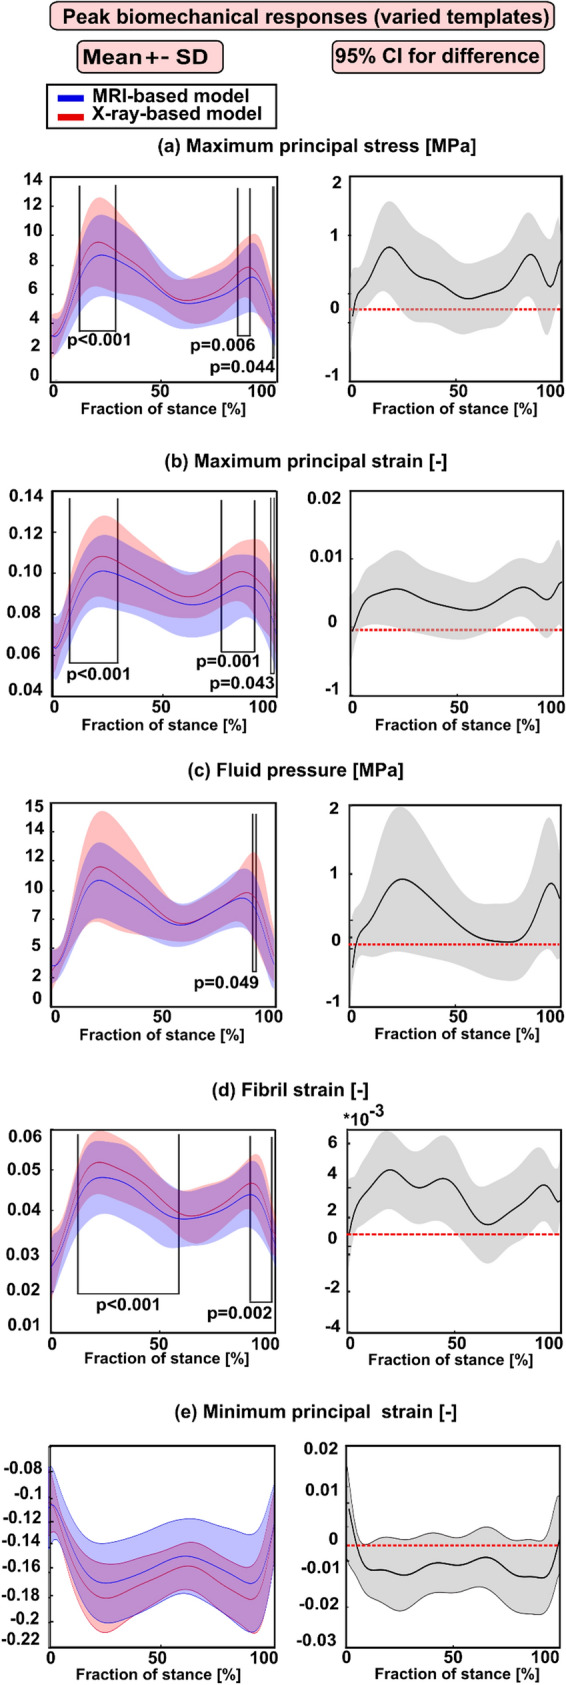
Figure 5.

Left column: mean values (± standard deviation) for the peak biomechanical responses over the cartilage–cartilage contact region in the X-ray- and MRI-based FE knee models (with varied templates) during the stance phase of the gait. (a) The maximum principal stress; (b) maximum principal strain; (c) fluid pressure; (d) fibril strain; and (e) minimum principal strain Statistical significances between the X-ray- and MRI-based models are shown based on the 1-D statistical parametric mapping. Right column: 95% confidence intervals (CI) for the difference (X-ray: MRI model) between the corresponding biomechanical response values during the stance phase of the gait.
