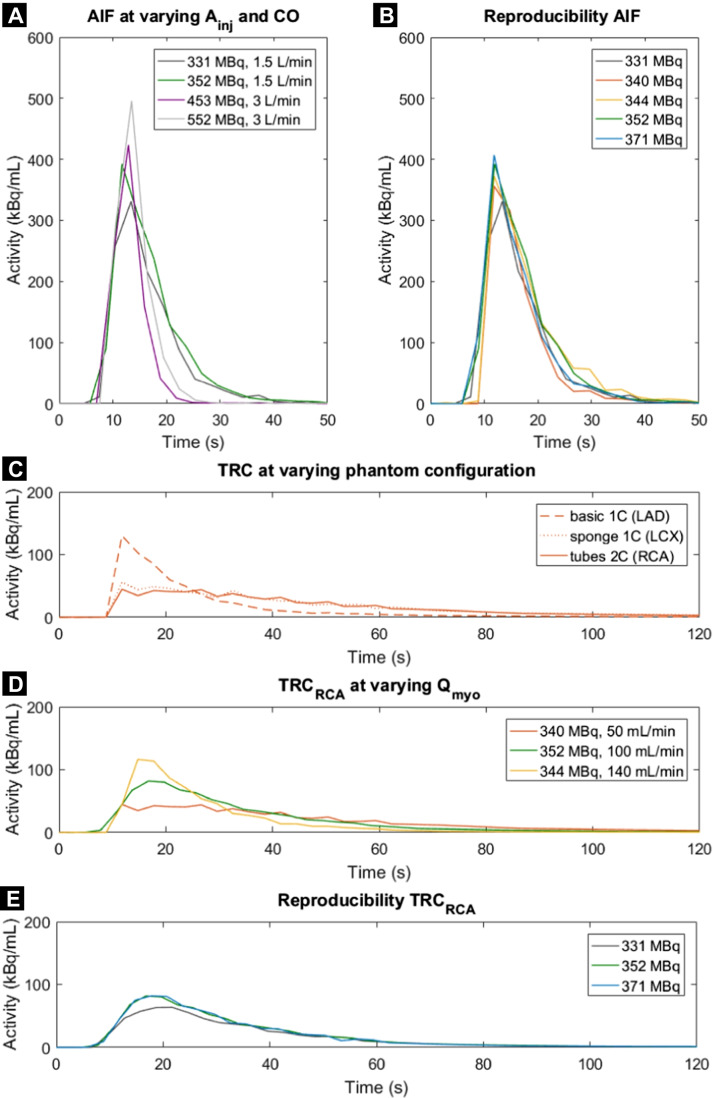
Fig. 4.
A–E Time activity curves obtained using the myocardial perfusion phantom. Arterial input functions (AIFs) were acquired in the left ventricle at varying injected activity of 99mTc-tetrofosmin (Ainj) and cardiac output (CO). Resulting tissue response curves (TRCs) in the three myocardial segments were executed at varying myocardial flow rates (Qmyo) and tissue inlays (1 or 2 compartments). Each line colour denotes a single flow measurement (n = 7). LAD = left anterior descending coronary artery, RCA = right coronary artery, LCX = left circumflex coronary artery

