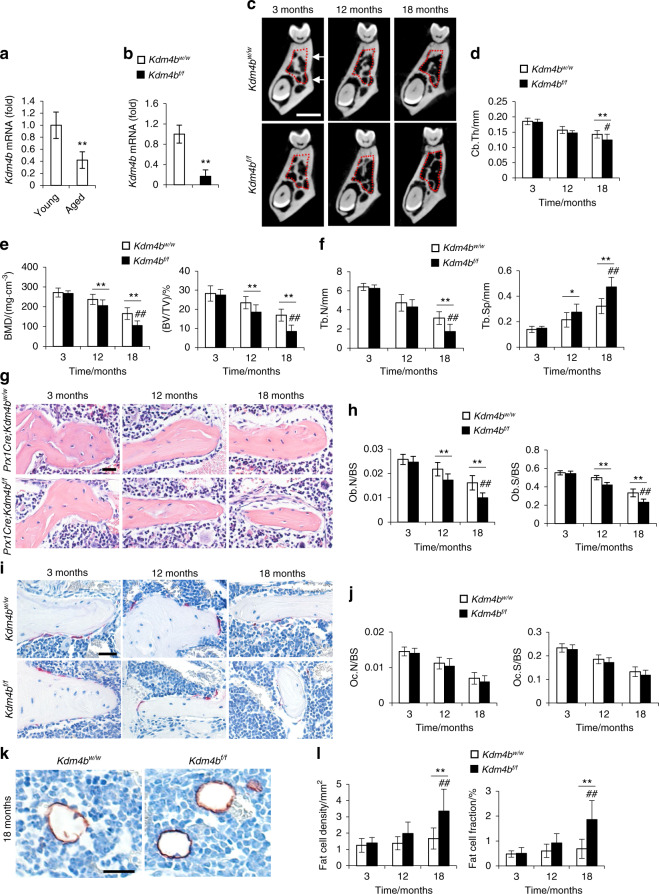
Fig. 1.
Deletion of Kdm4b in OMSCs enhances age-related bone loss and adipose accumulation in mandible. a qRT-PCR showing mRNA levels of Kdm4b in OMSCs isolated from young and aged mice. **P < 0.01. n = 5. b mRNA expression level of Kdm4b in OMSCs isolated from Prx1Cre;Kdm4bw/w (Kdm4bw/w) and Prx1Cre;Kdm4bf/f (Kdm4bf/f) mice. **P < 0.01. n = 6. c Three-dimensional (3-D) images of mandibles constructed by µCT from Kdm4bw/w and Kdm4bf/f mice at 3-, 12- and 18-month old, respectively. Scale bar, 1 mm. n ≥ 14 per group. Red dashed lines indicate the region of trabecular bone analysis performed, and the arrows indicate the limits for cortical thickness analysis. d Quantitative measurements of Cb.Th in mandibles from Kdm4bw/w and Kdm4bf/f mice. **P < 0.01; #P < 0 .05. n ≥ 14 per group. e BMD and BV/TV measurements by µCT of mandibular bone from Kdm4bw/w and Kdm4bf/f mice. **P < 0.01; ##P < 0.01. n ≥ 14 per group. f Tb.N and Tb.Sp quantification by µCT of mandibles from Kdm4bw/w and Kdm4bf/f mice. *P < 0.05; **P < 0.01; ##P < 0.01. n ≥ 14 per group. g Histological hematoxylin and eosin (H&E) staining of trabecular bones in mandibles from Kdm4bw/w and Kdm4bf/f mice. Scale bar, 30 µm. n ≥ 12 per group. h Histological data analysis of osteoblasts number and osteoblasts surface/bone surface (Ob.N/BS and Ob.S/BS, respectively) in mandibles from Kdm4bw/w and Kdm4bf/f mice. **P < 0.01; ##P < 0.01. n ≥ 12 per group. i TRAP staining of osteoclasts in mandibles from Kdm4bw/w and Kdm4bf/f mice. Scale bar, 40 µm. n ≥ 12 per group. j Quantitative data of Oc.N/BS and Oc.S/BS, respectively, from Kdm4bw/w and Kdm4bf/f mice. n ≥ 12 per group. k Histochemical detection of Perilipin-1 expression in mandibles from Kdm4bw/w and Kdm4bf/f mice. Scale bar, 30 µm. n ≥ 12 per group. l Density of adipocytes and the fat fraction of adipose tissue in mandibles from Kdm4bw/w and Kdm4bf/f mice. **P < 0.01; ##P < 0.01. n ≥ 12 per group

