Figure 4.

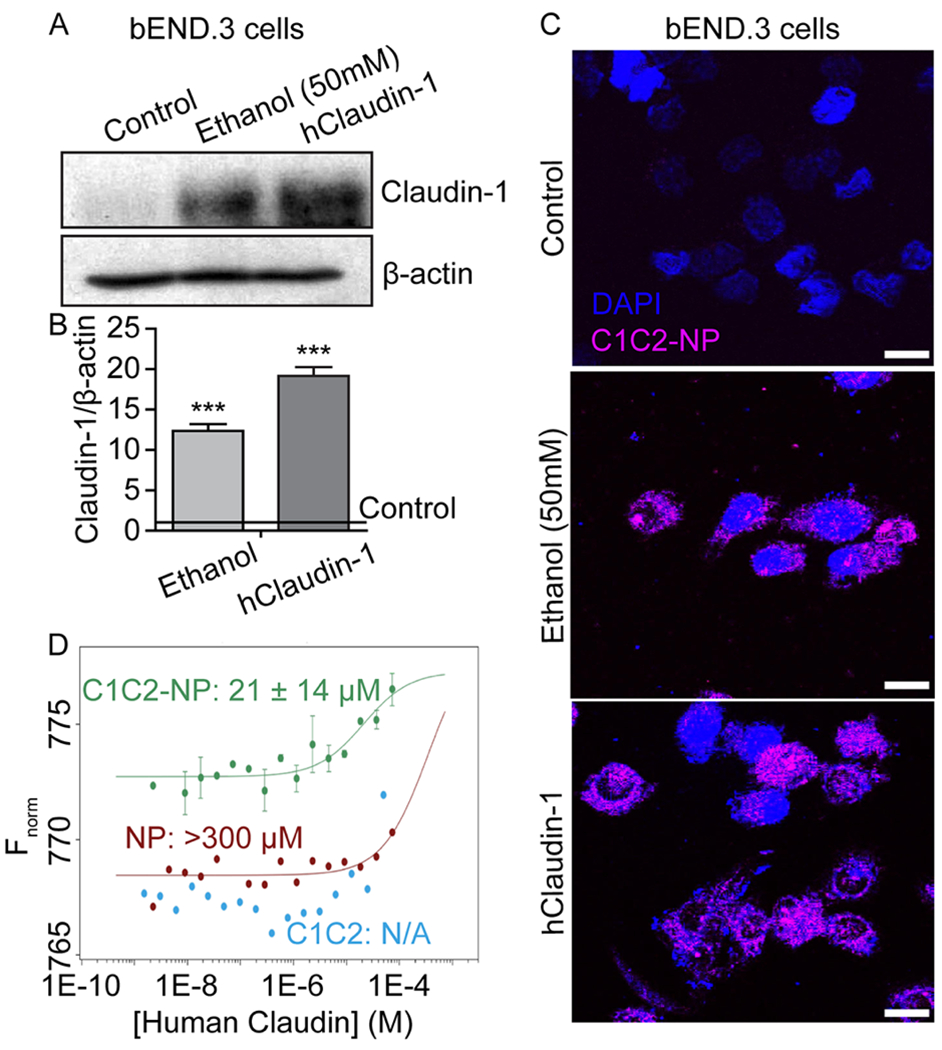
C1C2-NP specifically binds to both mouse and human Claudin-1. A-C) In vitro immunofluorescence of NPs binding claudin-1 in mouse brain endothelial (bEnd.3) cells. A) Western blot analysis of claudin-1 in bEnd.3 cells and those induced to express claudin-1 through ethanol exposure or exogenous expression through plasmid transfection. B) Quantification of claudin-1 expression relative to β-actin. *** indicates a statistical difference (p < 0.0001) in claudin-1 expression as compared to control cells. C) C1C2-NP (magenta) binding to ethanol induced mouse claudin-1 and exogenously expressed human claudin-1. Scale bar represents 10 μm. D) Dissociation constants (KD) for C1C2, C1C2-NP, and NP complex formation with human claudin-1. Binding curves for the complex formation between human claudin-1 and C1C2-NP (green), NP (red), and C1C2 peptide (blue) using microscale thermophoresis. The concentration of human claudin 1 was varied from 74 μM – 0.2 nM in all three experiments. The concentrations of C1C2-NP, NP, and peptide were fixed at 70 nM, 2 μM and 1 μM, respectively. The buffer used for the measurements contained 10 mM Tris HCl, pH 8.0, 100 mM NaCl, 4% glycerol and 0.04% b-DDM. The experimental data points with human claudin-1 and C1C2-NP are reported as standard deviations from two independent measurements. The estimated value of the dissociation constant is 21 ± 14 μM. Human claudin-1 does not show significant binding to the non-targeted NP as the dissociation constant is very high >300 μM. The data with the peptide alone does not fit at all indicating little binding with free peptide in solution.
