Abstract
Porous ion-exchange resins with features of high selectivity, high capacity, fast adsorption kinetics and chemical stability over a wide pH range are attractive for extracting precious metals like copper and upcycling waste. In this study, porous glutaraldehyde-polyethyleneimine (GA-PEI) particulate resin was synthesised using diatomaceous earth (DE) particles as a bio-template. The crosslinking of PEI by GA was successfully conducted on the surface of DE. Removal of the template DE, merely by chemical etching with potassium hydroxide, resulted in the porous GA-PEI particulate resin. The resin showed excellent selectivity for copper ions in binding and recovery from solutions as complex as real legacy acid mine drainage liquid. The copper ion uptake capacity of the GA-PEI resin was determined to be >8 times greater than non-etched GA-PEI-DE particles. Under the investigated conditions, the GA-PEI resin showed higher selectivity to copper ions from real legacy acid mine drainage liquid compared to the commercial resins Purolite S930 Plus and Lewatit TP 220. Importantly, the absorbed copper ions could be released by simply adjusting pH of the solution to 1. For uptake from acid mine drainage liquid at pH 4 and elution at pH 1, purer copper solutions were achieved with GA-PEI compared to Purolite S930 Plus or Lewatit TP 220 following two cycles of iteration. The results indicate the great potential for using the porous GA-PEI resin in copper extraction under real-world conditions.
Porous ion-exchange resins with features of high selectivity, high capacity, fast adsorption kinetics and chemical stability over a wide pH range are attractive for extracting precious metals like copper and upcycling waste.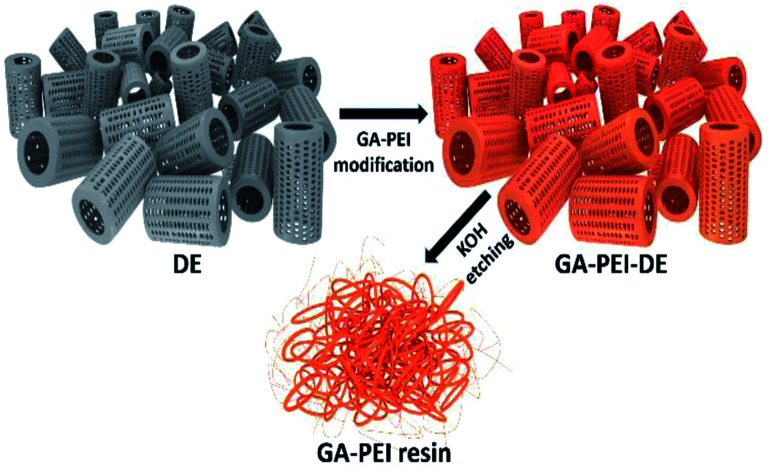
Introduction
Copper is mined in large quantities. Over the last ten years the volume of processed ore has increased continuously as the ore grade has declined.1–3 The recovery of copper from ore is never complete and remaining copper is left in tailings.4 With new regulations on mining, it may be a struggle to meet the exponential growth in copper demand with population increase and urbanisation.5 To meet such increasing demand it is imperative to not only improve efficiency of copper extraction, but also develop effective ways to source and recycle copper in the tailings and wastewater. Such methods should be fast, easy and economical, and requiring minimal consumption of energy, such as ion exchange and adsorption processes.6 It will not only mitigate the environment issue/pollution caused by copper ions in the wastewater but also add value by recycling copper.7
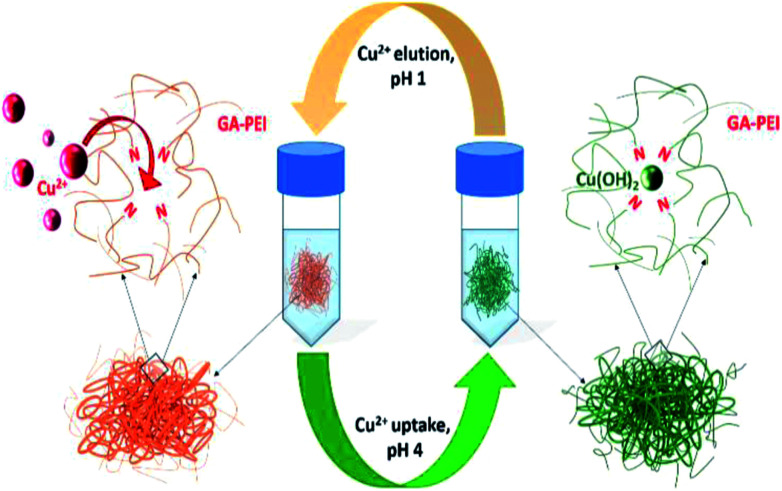
Among various current copper recycling methods such as ultrafiltration,8,9 electrodialysis,10 chemical precipitation,11,12 bioadsorption,13 froth floatation,14 photocatalysis,15 magnetic separation16etc., selective adsorption of copper ions followed by controllable release is one promising pathway.17,18 Recently, materials such as PEI resin attracted intensive research interest due to its strong affinity and selectivity to copper that can scavenge copper ions even at trace concentrations in seawater.19,20 Nanometer thin coatings of polyethyleneimine when crosslinked with glutaraldehyde (GA) demonstrated significantly enhanced selectivity towards copper even when organic material such as polysaccharides from the seawater were adsorbed on the coating's surface.21–23 However, to apply this material to extraction of copper from solutions with high copper ion concentrations, a much greater adsorption capacity of PEI resin is required. Porous structures are an excellent candidate to enhance the adsorption due to large surface areas and channels that enable rapid mass transport.24–26 Here, we utilized diatomaceous earth (DE) particles as a bio-template to prepare a porous, high surface area GA-PEI resin. PEI was crosslinked in the presence of GA on the surface of DE particles followed by chemical etching to remove the DE template, resulting in a porous GA-PEI particulate resin. The copper uptake was performed at pH 4 and the GA-PEI resin achieved much greater (>8 times) copper ion uptake capacity than the GA-PEI-DE particles. Liberation of the adsorbed copper was achieved by adjusting the pH of solution to 1. A graphical description for the cyclic process of copper uptake (pH 4) and elution (pH 1) is given in Scheme 1. The GA-PEI porous resin is capable of extracting copper from real legacy acid mine drainage (AMD) solutions, an industrial wastewater. Under the investigated conditions, GA-PEI showed superior performance in copper ion uptake capacity and selectivity compared to the commercial Purolite S930 Plus and Lewatit TP 220, confirming significant potential in real-world applications.
Scheme 1. A concept for high-surface area, high-capacity resins for Cu extraction from solution. Porous GA-PEI resin is prepared using diatomaceous earth as a template. In solution, Cu is specifically adsorbed via Schiff-base chemistry at pH 4 and can be eluted by lowering the pH to 1.
Experimental
Methods and materials
Commercial, fine DE particles were obtained from Diatomaceous Earth Online (Australia) and commercial synthetic resins Purolite S930 Plus and Lewatit TP 220 obtained from Lenntech (Australia). Branched polyethyleneimines (PEI) Lupasol® HF (56 wt% in H2O, MW = 25 000 g mol−1), and Lupasol® P (50 wt% in H2O, MW = 750 000) were provided by BASF (Sweden) and stored under N2. Glutaraldehyde (GA, 25 wt% in H2O) was purchased from Sigma-Aldrich (Australia). Copper(ii) sulphate pentahydrate (CuSO4·5H2O) and potassium hydroxide (KOH) were purchased from Chem-Supply (Pty Ltd) (Australia). The legacy acid mine drainage solutions were kindly provided by Copper Mines of Tasmania (Australia). 1 mol L−1 sulfuric acid and 2.5 mol L−1 sodium hydroxide solutions were prepared from reagent grade concentrated H2SO4 (98 wt%) (Scharlau Chemie, Australia) and NaOH pellets (Chem-Supply, Australia), respectively. Nitric acid (HNO3) (<69%, TraceSELECT®, for trace analysis) was bought from Sigma Aldrich (Australia). Ultrapure water with a resistivity of 18.2 MΩ cm was obtained using a Milli-Q® Advantage A10 water purification system and the pH was monitored during experiments using an ION 700 meter equipped with a pH electrode (Eutech Instruments, Singapore).
Porous DE templated GA-PEI preparation
The method adopted for the GA-PEI coating of the DE particles, reported previously,17 is described briefly here: first, DE particles were purified using concentrated sulfuric acid followed by washing in Milli-Q water and drying at 100 °C. The dried particles were dispersed in 1 wt% solution of PEI in 0.5 mol L−1 NaCl at pH 9, achieving a final concentration of 10 wt% (DE plus PEI). Dispersion was achieved by ultrasonication for 15 minutes, followed by mixing on an orbital mixer for 30 minutes. The particles were then separated by centrifugation, rinsed 3× in Milli-Q water and suspended in 0.5 wt% glutaraldehyde solution for cross-linking PEI with thorough mixing (30 minutes). Finally, particles were washed 2× in Milli-Q water, 2× with sulfuric acid at pH 1 and 2× with Milli-Q water and dried overnight at 80 °C.
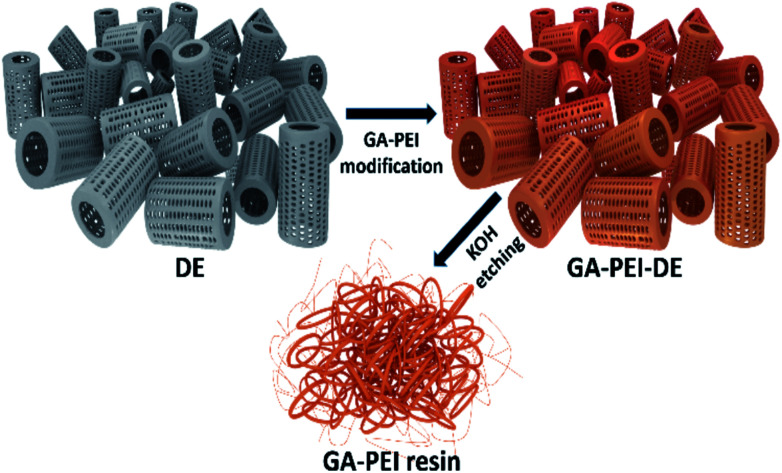
The GA-PEI coated DE particles were used as a template and a selective etching of silica was performed using alkaline KOH solution to obtain the porous GA-PEI particulate resin as illustrated in Fig. 1. The method applied was as follows: first, 2 wt% of GA-PEI-DE particles were dispersed in 50 mL of 4 mol L−1 KOH solution in falcon tubes. The etching was performed over six days and dispersions were agitated on an orbital mixer to promote uniform etching. In fixed intervals of 24 hours, the particles were centrifuged down at 4000 rpm for 5 minutes with a small amount (ca. 0.1 g) of sample extracted for analysis and solution was replaced with fresh 50 mL of 4 mol L−1 KOH. Second, after the etching process was complete, the product was washed 5× sequentially with Milli-Q water to remove salt ions and other unwanted residues and separated from solution by centrifugation. Finally, the particles were dried in the oven at 60 °C overnight. The dried product, obtained as a hard pellet, was crushed to a fine powder using a mortar and pestle and stored in a desiccator to ensure moisture control.
Fig. 1. Two-step process of synthesis of glutaraldehyde crosslinked polyethyleneimine resins using diatomaceous earth particles as biotemplate.
X-ray photoelectron spectroscopy
The rate of silica dissolution during KOH etching of the DE template was examined over six days at 24 hour intervals. Each dried pellet was ground to a fine powder for which the silica content and Si/N ratio was evaluated using XPS. The XPS measurements were undertaken using monochromatized Al Kα-rays (1486.7 eV) at a power of 225 W on a Kratos Axis-Ultra spectrometer (160 eV analyzer pass energy for survey scans, 20 eV for high-resolution scans) and an analysis spot size of ∼300 × 700 μm. The data processing (peak fitting) and quantification was performed with the casa XPS software, using a Tougard type background subtraction. A single sample was analyzed for each time-point and the elemental composition of the sample was determined as the average of measurements at two different spots.
Mastersizer
The dispersion of GA-PEI resins in Milli-Q water was used for analyzing the average particle size distribution by laser diffraction using Mastersizer 2000 (Malvern Instruments Ltd., U.K.). The particle sizes of 10%, 50% and 90% of the total volume distribution are reported as D10, D50 and D90 respectively.
Scanning electron microscopy (SEM) and EDX analysis
A drop from the dispersed GA-PEI-DE/GA-PEI particles in Milli-Q water was placed on a conducting carbon sticker over an SEM stub by using a glass Pasteur pipette. The particles were air dried followed by coating of a gold layer through a sputtering technique to avoid charging in the electron microscope. The SEM images were obtained using a Carl Zeiss Microscopy Merlin SEM with a GEMINI II Column. The SEM was operated at 2 kV in a high-resolution column mode (probe current: 100 pÅ) and the working distance was optimized to 2.5 mm. The secondary electron images were recorded by Everhart–Thornley secondary electron detector. The composition was examined using energy dispersive X-ray (EDX) spectroscopy attached to the SEM. Also, the hydration and joint swelling of the GA-PEI resin was observed under ESEM (FEI Quanta 450 FEG Environmental Scanning Electron Microscope).
Copper uptake kinetics by GA-PEI resin
To evaluate the rate of adsorption of copper by the GA-PEI resin, 0.087 g of GA-PEI particles were dispersed in 100 mL of 50 ppm copper solution in Milli-Q water under constant agitation using an overhead stirrer. The pH of the solution was set to 4.06 using 0.1 mol L−1 H2SO4. The copper uptake was monitored over 5 hours with 1 mL extracted at predetermined times and filtered through a 0.45 μm PTFE syringe filter. The collected samples were analysed for the extent of copper ion removal by calculating the concentration of residual copper ions in solution using UV-visible spectrophotometry.
Adsorption isotherm
To understand the mechanism and efficacy of copper adsorption of the GA-PEI resin, an isotherm was determined and compared with two commercial resins, Purolite S930 Plus and Lewatit TP 220. Prior to use, commercial resins Purolite S930 Plus and Lewatit TP 220 were purified according to the following protocol. The measured amount of resins were dispersed in Milli-Q water and agitated at room temperature for 24 hours followed by centrifugation at 4000 rpm for 5 minutes and supernatant was discarded. The resins were then washed with pH 1 H2SO4. After agitation for 30 minutes, resins were centrifuged (4000 rpm, 5 minutes), supernatant discarded and resins washed 3× in Milli-Q water. The pH of solution was then adjusted to 4 using 2.5 M NaOH and dispersed with agitation for 30 minutes before centrifuging as above, supernatant discarded and resins washed 3× in Milli-Q water followed by drying in the oven overnight at 45 °C.
For adsorption tests, a series of 50 mL falcon tubes were employed and filled with a constant volume of 40 mL of the solution spiked with 50 mol L−1 copper ions. The resins were added in varying concentrations ranging from 0.025–0.15 wt% and the pH of dispersions was adjusted to 4. The dispersions were agitated on an orbital shaker and centrifuged at 4000 rpm for 5 minutes after the equilibrium was assumed to have been established by 24 hours. The supernatant was collected for the analysis of the residual copper ion concentration with UV at λmax of 275 nm.
UV-visible spectroscopy
The copper uptake kinetics were determined and adsorption isotherms were established from 50 ppm copper solutions in Milli-Q water at pH 4. After the copper ion uptake, UV-visible spectrophotometry (Varian Cary 300 Bio UV-Vis Spectrophotometer) was used to quantitatively determine the concentration of equilibrated Cu2+ ions remaining in solution. The absorption spectra was recorded for the samples within the wavelength range of 200–800 nm. The method utilized the wavelength of maximum absorption λmax at 275 nm, a characteristic of a UV active cuprammonium complex (Cu2+–PEI) formed as a result of Cu2+ ion chelation to polyethyleneimine and the absorbance dependent concentration of residual copper was determined. The calibration was performed to establish the response of the measurement system to the known concentrations of copper in solution. A linear relationship between absorbance and Cu2+–PEI concentration was derived (Fig. S1, ESI†) and utilized to determine the concentration of copper corresponding to the absorbance recorded for experimental samples at λmax of 275 nm.
The amount of copper adsorbed by the particles Qe (mg g−1) was determined from the residual concentration of copper remaining in solution post equilibrium, according to the relation: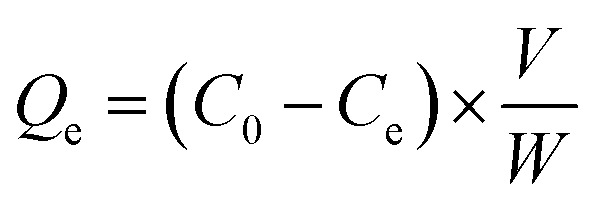 where, C0 and Ce are initial and saturated concentration of copper (ppm) in solution respectively, V is the volume of copper solution (mL) and W is the mass of sorbent (g).
Preparation of standard Cu–PEI solutions
A series of standard solutions of copper were prepared by diluting a 0.1 mol L−1 stock solution in Milli-Q water. Also, a standard working solution of PEI (0.1 mg mL−1) was prepared by diluting a 5 mg mL−1 stock solution in Milli-Q water. PEI and copper solutions were mixed such that the molar concentration of PEI was 20 times more than the highest used molar concentration of copper for a fixed volume of the resulting cuprammonium complex (Cu2+–PEI) to ensure that the entire copper was bound to PEI. The absorbance of Cu–PEI solutions was measured at λmax of 275 nm and a calibration curve, i.e. a plot of absorbance vs. known concentration, was obtained (Fig. S1, ESI†). All the subsequent measurements were done within the calibrated range of copper concentrations.
Sample preparation for UV spectrophotometry
From the experimental test solutions containing copper, 1.5 mL was extracted using a 3 mL syringe and filtered through a 0.45 μm PTFE syringe filter. From the filtrate, 443.4 μL was added to 2556.6 μL of 0.1 mg mL−1 standard working solution of PEI and 3 mL of the resulting solution containing Cu2+–PEI complex was analysed for its absorption spectrum with a UV-visible spectrophotometer. The absorbance at 275 nm (λmax) was compared against the calibration curve for determining the copper concentration for the test samples.
Cu(ii) ion removal and recovery properties of GA-PEI compared with commercial resins from acid mine drainage solutions
A comparative study was performed between GA-PEI and commercial resins Purolite S930 Plus and Lewatit TP 220 for their efficiency of copper recovery from complex, metal rich industrial AMD solutions. The two AMD liquids used in the experiments were legacies from previous mining operations in the Mt Lyell area and were sampled from mine dewatering (MD) and leach pile (LP). They contained similar metals but at different concentrations. The experimental procedure was as follows: 200 mL of AMD solution was poured to a 500 mL glass beaker and under constant magnetic stirring, pH of the solution was adjusted to 4. From 200 mL of the solution at pH 4, a 100 mL aliquot was centrifuged at 4000 rpm over 5 minutes and the supernatant comprising dissolved metals was separated.
The copper extraction was performed in 10 mL of non-centrifuged (containing precipitated as well as dissolved metals) and centrifuged (supernatant containing only dissolved metals) AMD solutions in the presence of 3× excess resins. Dispersions were mixed for 24 hours to equilibrate the resin bound copper to that in solution, with pH monitored and kept at ∼ pH 4 using H2SO4/NaOH to prevent copper from precipitation at higher pH,27,28 following which the resins were centrifuged again at 4000 rpm for 5 minutes. 1 mL of the supernatant was extracted from the solution for analysis of the metal content with ICP-OES. The pellets obtained after centrifugation were separated from solution, washed 2× sequentially in Milli-Q water at pH 4 with mixing over 15 minutes each time and centrifuged at 4000 rpm for 5 minutes. Finally the copper was eluted from the pellet in 10 mL of pH 1 solution prepared using H2SO4 with mixing on an orbital mixer for 30 minutes. 1 mL of the solution was collected for analysis of the metal content by ICP-OES. To test reproducibility of results, the study was carried out in duplicates with the uptake and elution cycle iterated two times to both purify the solutions in terms of copper as well as examine the regeneration capability of the resin.
Inductively coupled plasma optical emission spectroscopy (ICP-OES)
The metal content of the samples after uptake and elution tests from real AMD solutions were analyzed through ICP-OES (Perkin Elmer ICP-OES Optima 7300DV). The sample preparation was done where 1 mL of the sample solution was extracted and diluted 40× in Milli-Q water and acidified using 3–4 drops of HNO3 to prevent bacterial growth in the containers. All the results were processed with MSF (Multicomponent Spectral Fitting). Calibration standards and QC standards were prepared in 1% HNO3.
Results and discussion
Rate of etching of GA-PEI DE particles determined through XPS analysis
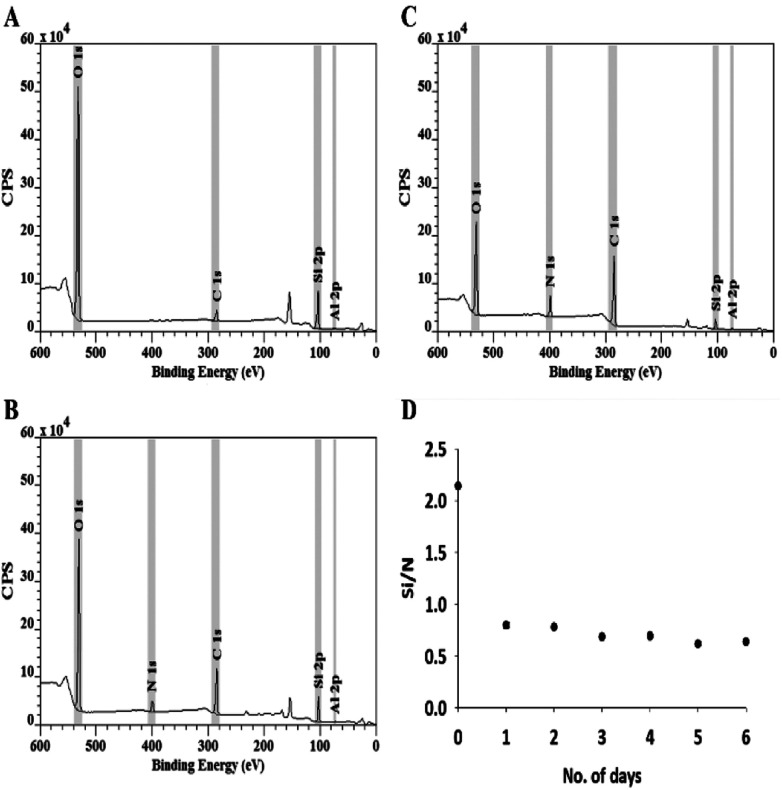
The interaction of a strong base, KOH, with GA-PEI-DE particles preferentially dissolves silica,29 leading to the continuous decrease of Si content in the resulting particles. XPS survey spectra depict the elements of O, N, C, and Si in DE (Fig. 2A), GA-PEI-DE (Fig. 2B) and GA-PEI (Fig. 2C) particles respectively. It is noticed that the N peak appears and C peak is intensified in the XPS spectra of GA-PEI-DE (Fig. 2B) confirming the formation of crosslinked PEI coating on the surface of DE template. Further intensification of N and C peaks coupled with a decrease in Si (Fig. 2C) results from the etching process. The Si 2p peak was utilized to quantify silica. The calculated Si/N ratio of samples after different etching times is shown in Fig. 2D, which evidently shows that the major portion (71%) of silica from the template DE particles was removed by etching within just one day of exposure to the etching solution. Further increase of etching time leads to little change in Si content. One of the two probable reasons for the decrease in etching rate could be the time i.e. temperature and concentration being insufficient for the complete removal of silica. Etching of silica in highly concentrated alkaline etching solutions is generally facilitated at high temperature (often boiling) conditions30 which is avoided in this study to preserve the physical stability and chemical integrity of the GA-PEI on the surface of template DE. Secondly, the DE particles may also have low levels of crystalline silica31 which has higher activation energy for the dissolution compared to amorphous silica and also rate of reaction varies along the differently oriented crystallographic layers32,33 in the DE structure and thus limit the kinetics of etching process. Therefore, the etching time applied for the preparation of GA-PEI resin in this study is 24 hours.
Fig. 2. XPS survey spectra showing quantitative peaks of constituting elements in (A) acid washed DE, (B) GA-PEI-DE and (C) GA-PEI resin after the 6th day of etching. The quantified peak areas of elements were used to determine (D), the relative Si/N ratio for GA-PEI resins reported with respect to the duration of etching (no. of days). Error bars indicate (±)S.D. between measurements over spots per sample (n = 2).
Particle size distribution using mastersizer
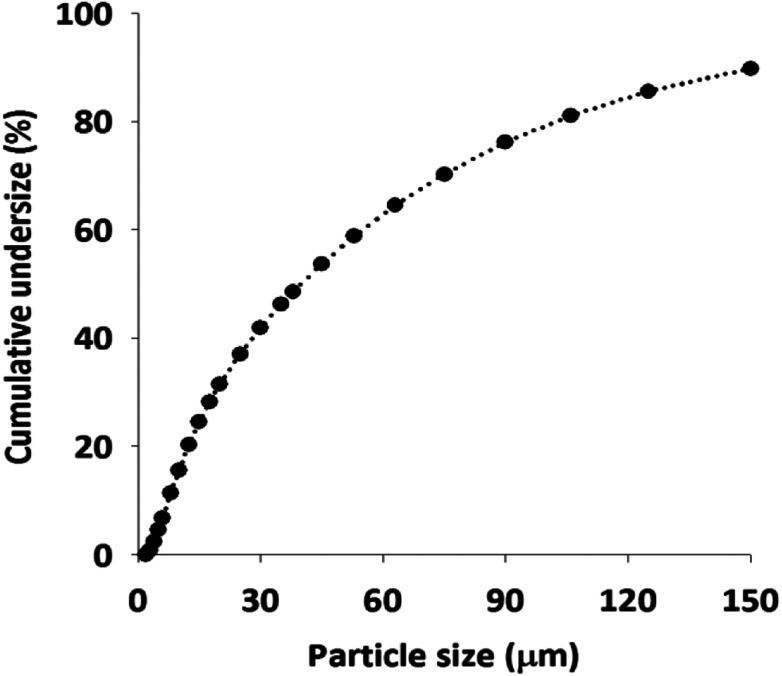
The size and size distribution of the obtained GA-PEI resin particles were characterized by a mastersizer. As shown in Fig. 3, a wide size range from 2–150 μm was detected. About 80% of the particles were below 100 μm. The particle diameters of the 10th (D10), 50th (D50) and 90th (D90) percentile were found to be 7.4 μm, 39.9 μm, and 152 μm respectively. The polydispersity in the size of GA-PEI particles is ascribed to the non-uniform DE templated particles (Fig. S2, ESI†). A large fraction of small cracked pieces of DE together with the intact ones were observed.
Fig. 3. Particle size distribution of GA-PEI resin.
Surface morphology studies through scanning electron microscope (SEM) coupled with energy dispersive X-ray spectroscopy (EDX) for elemental analysis
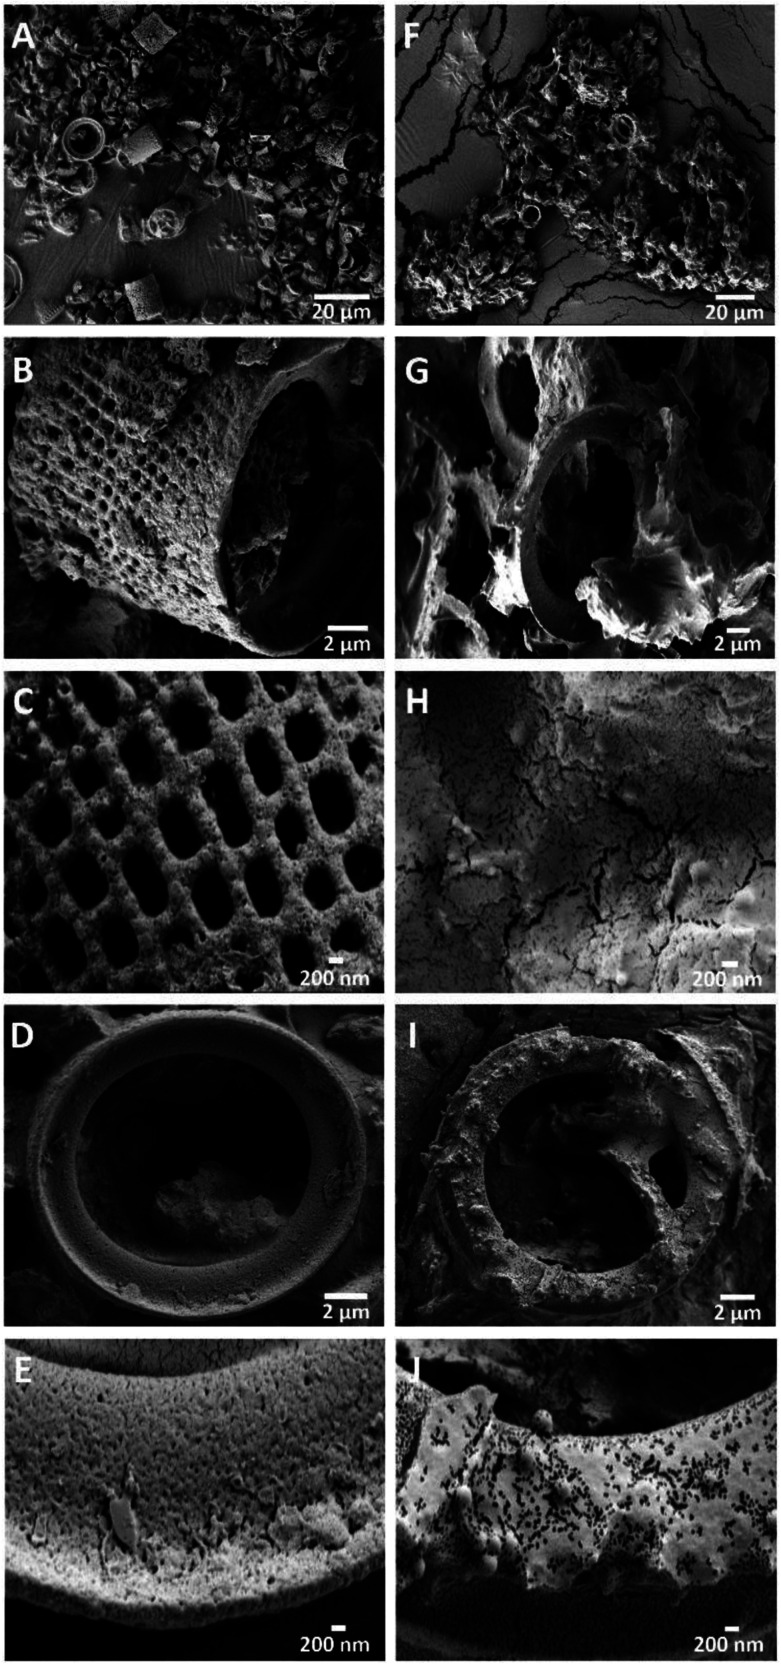
SEM imaging was conducted to investigate the morphology of the GA-PEI-DE particles and the GA-PEI resin after DE etching. Fig. 4A shows microscale hollow cylindrical frustules of GA-PEI-DE laying between fragments of cracked DE particles. Individual frustules were ∼11 × 14 μm (Fig. 4B) with macropores of size of 450–500 nm arranged in rows exhibiting a mesh like tapestry along the sidewalls. A magnified view of the framework (Fig. 4C) reveals the existence of mesopores (∼45–60 nm), rendering a hierarchical porous structure of GA-PEI-DE particles. It is noticed that each frustule had a ring opening at either end (Fig. 4D) which also appeared to be porous (Fig. 4E). The overall morphology and structure of the GA-PEI-DE agree well with that of pristine DE particles (Fig. S2, ESI†), which indicates that the GA crosslinking of PEI on DE surface has no observable impact on the morphology and structure.
Fig. 4. SEM images presenting morphology of GA-PEI-DE particles at different length scales (A–E). Likewise, (F–J) show GA-PEI resin after etching at different length scales.
After etching, it was found that the structure of the sidewall collapsed, only rings remained (Fig. 4F–G). It is reasonable that due to the removal of framework (Si) from the porous sidewall by etching, the relatively soft GA-PEI coating fails to support the structure, inducing the collapse of the sidewall. However, small pores and cracks still exist on the collapsed surfaces (Fig. 4H). Similar to GA-PEI-DE particles, mesoporous structure in the rings is preserved after etching (Fig. 4J). The etched GA-PEI particles are sensitive to the environmental humidity. As shown in the environmental SEM images (Fig. S3, ESI†), it is clear that the GA-PEI fragment swells remarkably with increasing humidity levels. This suggests capillary condensation of water molecules in the pores, which can further promote ion adsorption in the aqueous solution.
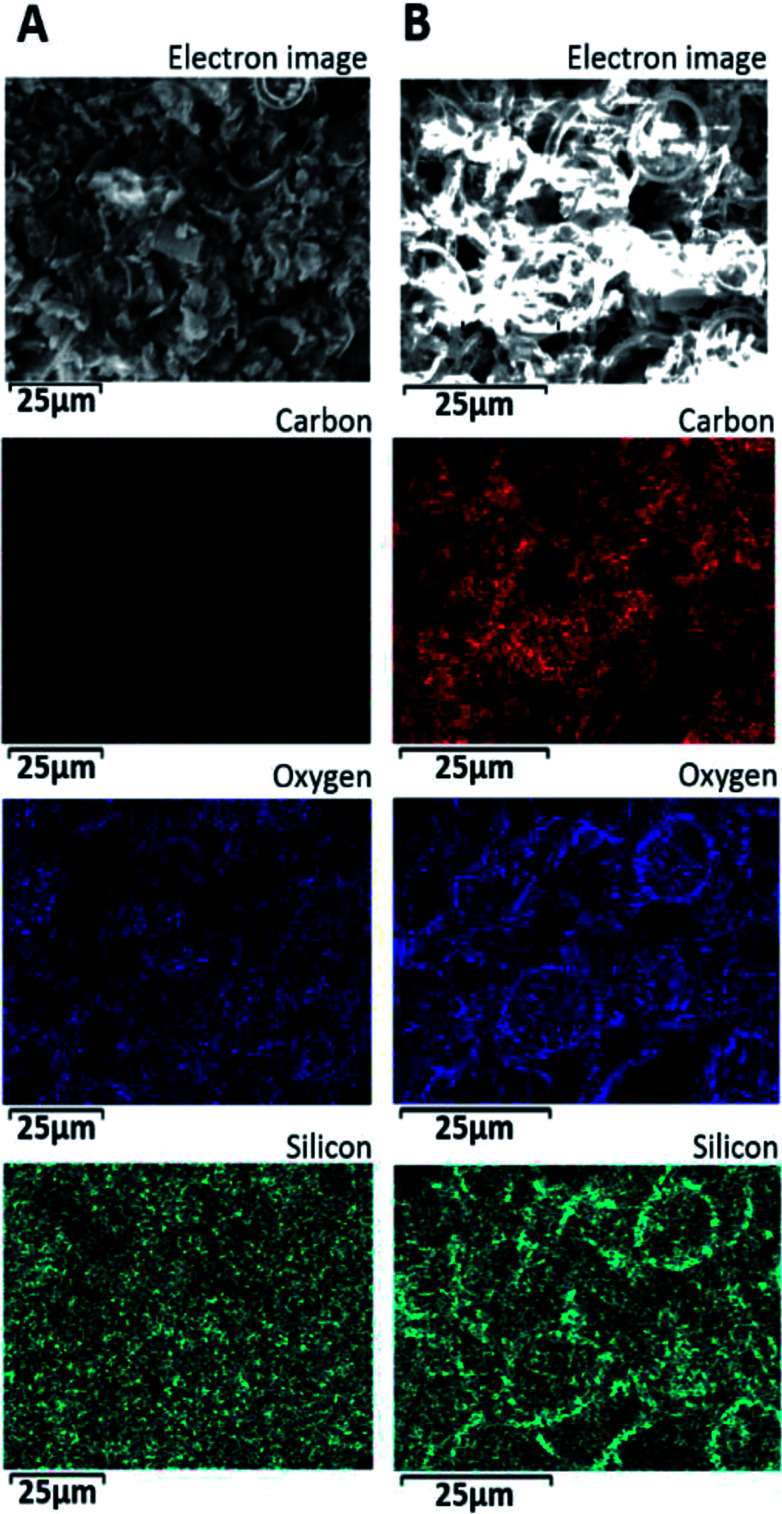
Spatial element distribution of the GA-PEI-DE and GA-PEI particles was investigated with Energy dispersive X-ray spectroscopy (Fig. 5). The elemental mapping indicate that the GA-PEI-DE particles (Fig. 5A) have strong Si signal and relatively weak C and O. After etching, an increase in the relative quantity of carbon and oxygen was observed (Fig. 5B), although the Si signal in GA-PEI particles appears brighter as compared to GA-PEI-DE. This could be due to an underestimation of Si content before etching due to the limited depth penetration of the analysis subsurface hollow volume of the cylindrical 3-D frustules, whereas after etching and collapse of the frustules the sample surface of GA-PEI appears relatively flat. The escape depth of the Si X-rays is considerably greater than those for C and O and can then appear to indicate a greater content of Si per volume. In support of this observation is the subsequent 10 fold decrease of Si/C atom% ratio from 3.27 ± 0.4 to 0.33 after etching determined as the average of measurements at four different spots on the sample. Also, the residual silica present after etching is associated with the circular structures at the ends of the frustules (Fig. 5B), which explains why the ring structure is retained after etching.
Fig. 5. Electron micrographs along with corresponding spatial maps of elemental distributions for (A) GA-PEI-DE and (B) GA-PEI resin obtained by energy dispersive X-ray spectroscopy.
Cu uptake kinetics investigated through UV-visible spectrophotometry
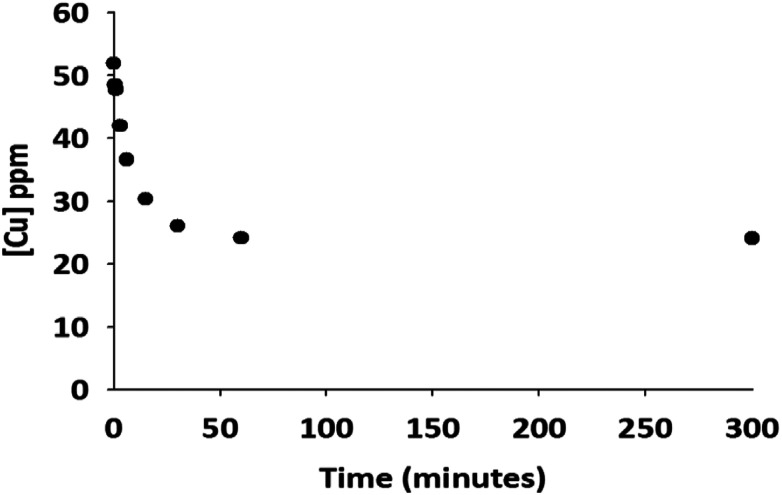
The kinetics of copper ion adsorption by the resulting GA-PEI resin particles was investigated. In Fig. 6, the amount of copper ion remaining in solution after different uptake times is presented. The copper concentration rapidly drops from initial 51.8 ppm to 30.3 ppm within 15 minutes, reaching 77% of its adsorption capacity. The adsorption was completed within one hour.
Fig. 6. Cu2+ absorption kinetics to GA-PEI resin. Concentration of copper remaining in solution (ppm) is given as a function of absorption time (in seconds). The copper concentration was determined through the UV-visible spectroscopy assay described.
Adsorption isotherm
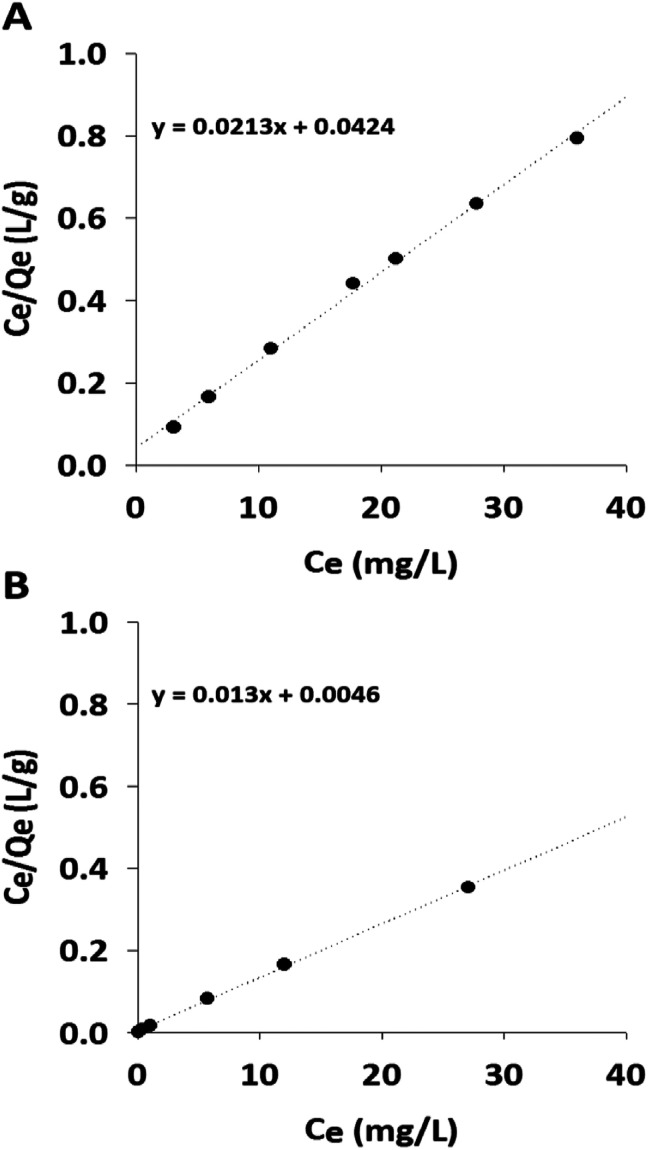
The maximum adsorption capacity and binding affinity of the GA-PEI resin for copper ions was investigated and performance compared against two commercial resins, Purolite S930 Plus and Lewatit TP 220. The amount of copper adsorbed by the resins was determined by the solution concentration change monitored with the UV-assay. The isotherms in Fig. 7 and experimental values summarized in Table 1 include the results from GA-PEI and Purolite S930 Plus resins only. The UV-Vis spectrum for the Lewatit TP 220 resin indicated an undesirable leaching of material from the resin which interfered with the analysis resulting in the distortion of absorption peak intensity (λmax) by an overlapping absorption band at 275 nm (Fig. S4, ESI†). The leaching was also confirmed visually as the solutions turned yellow after copper uptake. Therefore, the absorption peak at 290 nm was utilized to monitor the residual copper concentration corresponding to varying concentrations of resins (Fig. S5, ESI†). However, the calculated capacity is an approximation and less than would be in the case of no leaching for Lewatit TP 220 resins. Thus to avoid reporting undermined capacity data, the results for Lewatit TP 220 resins are not discussed further in this section.
Fig. 7. Langmuir adsorption isotherms of copper from aqueous solutions in 50 ppm solution in Milli-Q water at pH 4 for varying concentrations of (A) GA-PEI resin and (B) Purolite S930 Plus resin.
Langmuir isotherm constants and correlation coefficients calculated from experimental data.
| Particles/resins | Q 0 (mg g−1) | K (L mg−1) | R 2 |
|---|---|---|---|
| Etched GA-PEI-DE | 46.9 | 0.5 | 0.9972 |
| Purolite | 76.9 | 2.8 | 0.9994 |
The adsorption on GA-PEI and Purolite S930 Plus resins was found to obey the Langmuir model for which the equation in its linearized form is given by: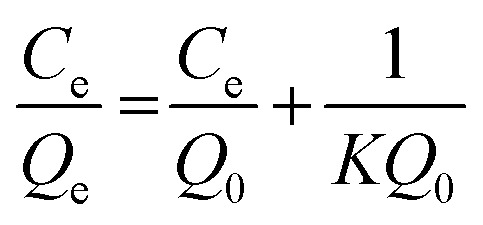
Here Qe refers to amount of copper adsorbed per unit mass of the resin (mg g−1) and Ce is the residual copper concentration in solution (ppm) at equilibrium. Q0, the maximum amount of bound copper per unit mass, i.e. capacity (mg g−1) is calculated from the slope (1/Q0) of the straight line from the Ce/Qevs. Ce plot. The equilibrium constant or the representative of the binding strength of the resins K (L mg−1), is calculated from Q0 and y-intercept of the same plot (1/KQ0).
The Langmuir model describes sorption of a monolayer of copper ions on the fixed number of binding sites and/or functional groups on the resins. The regression correlation coefficient value was greater than 0.99 indicating good fit of isotherm data to the model. The results also demonstrated more than eight fold higher binding capacity (46.9 mg g−1) of GA-PEI resin to that of GA-PEI-DE (5.4 mg g−1) reported elsewhere.34
Cu(ii) ion removal and recovery properties of GA-PEI compared with commercial resins from real acid mine drainage solutions
The performance of GA-PEI resins for copper extraction in the presence of other competing ions from the complex, real legacy acid mine drainage (AMD) solutions was evaluated and compared against the two commercial resins, Purolite S930 Plus and Lewatit TP 220. The AMD solutions were characterized non-centrifuged and centrifuged to differentiate and account for the quantity of each metal chelated to the resin compared to that precipitated in solution.
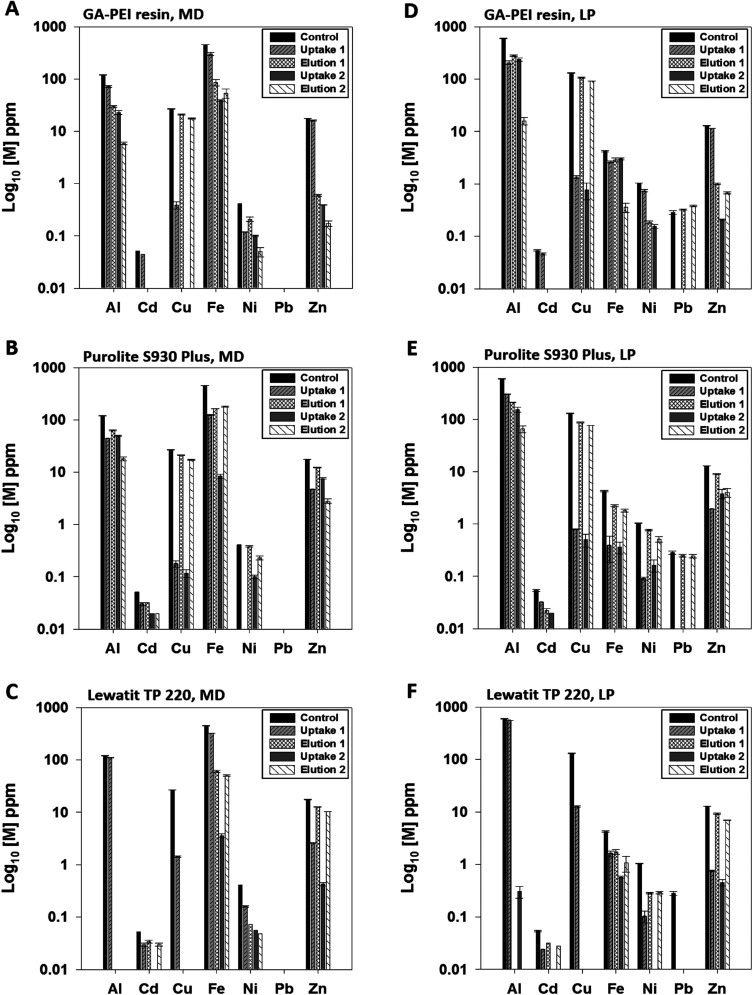
The initial concentrations of metals in mine dewatering AMD and leach pile AMD solutions for non-centrifuged and centrifuged solutions before the addition of resins are summarized in Table 2. Here the results from only centrifuged solutions are discussed, however data for the non-centrifuged samples are provided in the ESI.† It can be seen that in the AMD solution from mine dewatering, aluminium (>100 ppm) and iron (∼450 ppm) were the most prevalent ions compared to copper (26.7 ppm), whereas in the leach pile solution, aluminium (>500 ppm) was the only element more abundant than copper (>100 ppm), and followed by zinc (<20 ppm) in both solutions. In Fig. 8, following the first uptake at pH 4, the resins reduced the copper concentration to less than 1 ppm in solution except for the Lewatit TP 220. The Langmuir adsorption isotherms revealed higher copper binding capacities for Purolite S930 Plus and Lewatit TP 220 resins from a single metal solution at pH 4. However, in real and complex solutions such as AMD where copper is present at much lower concentration compared to other metals such as aluminium and/or iron, GA-PEI extracted copper most selectively outperforming both the commercial resins. For the sorption of Zn, Ni and Cd, Lewatit TP 220 demonstrated the highest sorption affinity followed by Purolite S930 Plus and GA-PEI bound the least of all the three metals. Also, lead precipitates at pH 4 and variation in its reported eluted concentration in Fig. 8D could be due to the difference in the capture of precipitates over filtration. The elution of the bound metals was performed in the same volume (10 mL) of H2SO4 solution at pH 1 and the efficiency of copper recovery was evaluated. Even though the centrifugation at pH 4 removed precipitates, the presence of resins in supernatant caused further hydrolysis of dissolved metals such as aluminium and iron resulting in their increased rate of precipitation as hydroxides that re-dissolve at pH of 1 and contaminate copper purified eluates. The contamination was reduced through washing with Milli-Q water at pH 4 in between uptake and elution and even further after the second elution cycle in case of all the resins.
Metal concentration (ppm) at pH 4 of the mine dewatering and leach pile samples of the acid mine drainage liquid. The conditions used were non-centrifuged (NC) and centrifuged (C) before the addition of resins with concentrations determined through ICP-OES. Errors indicate ±min/max (n = 2).
| [M] ppm | Mine dewatering (NC) | Mine dewatering (C) | Leach pile (NC) | Leach pile (C) |
|---|---|---|---|---|
| Al | 158.4 ± 1.4 | 119.6 ± 1.2 | 813.2 ± 2.4 | 590 ± 7 |
| Cd | 0.1 | 0.1 | 0.1 | 0.1 |
| Cu | 30.4 | 26.7 | 133.5 ± 0.5 | 130.7 ± 1.2 |
| Fe | 959.8 ± 18.6 | 451.6 ± 2.8 | 654.2 ± 11 | 4.2 |
| Ni | 0.4 | 0.4 | 1 | 1 |
| Pb | <0.005 | <0.005 | 0.3 | 0.3 |
| Zn | 18.5 | 17.5 | 12.1 | 13 |
Fig. 8. Bar graphs showing concentration of metals remaining in solution following uptake/elution cycles in centrifuged mine dewatering AMD (A–C) and leach pile AMD (D–F) for all the resins. In legends, control refers to the centrifuged MD/LP AMD at pH 4 without resins. Error bars indicate ±min/max (n = 2). Bars are missing where data was below detection limits.
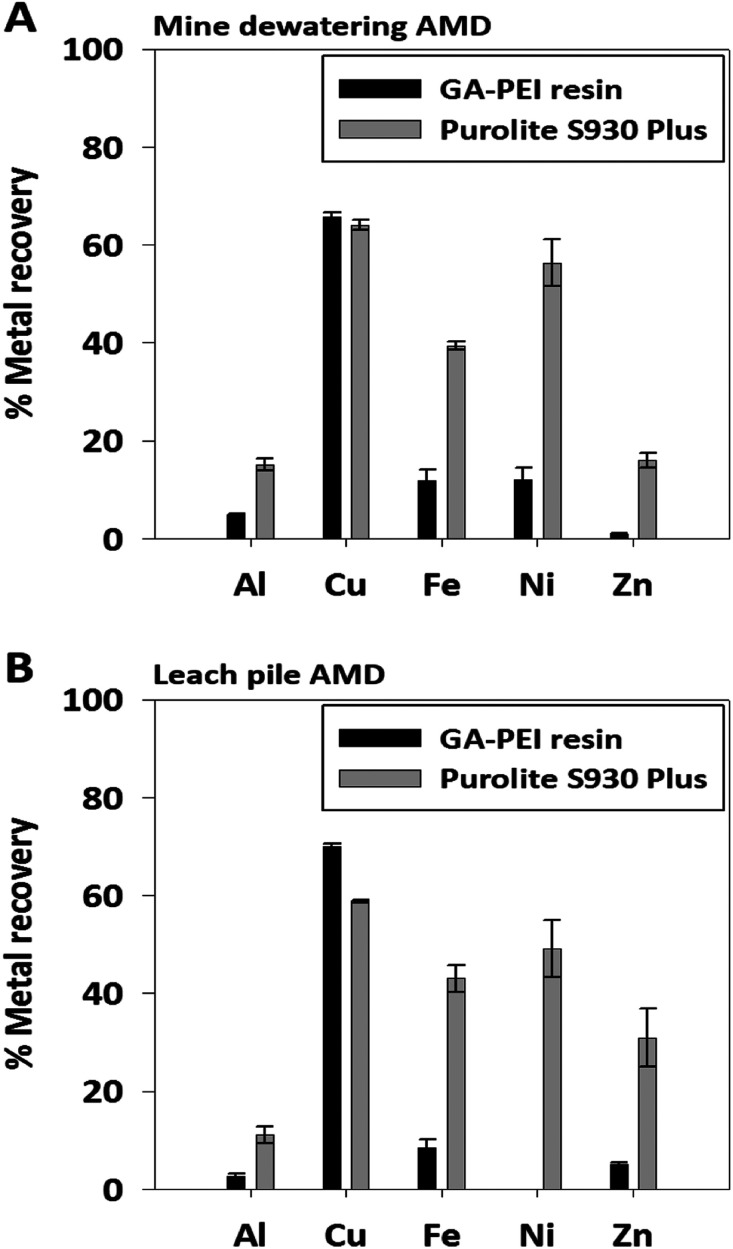
For the evaluation of eluate composition after the second and final elution cycle, the percentage of metal recovery in both the AMD liquids was normalized for GA-PEI and Purolite resins. In Fig. 9, under the used conditions, only GA-PEI and Purolite S930 Plus resins could elute copper with GA-PEI presenting the highest copper recovery of 65% from mine dewatering and 70% from leach pile AMD as compared to Purolite S930 Plus resins in which case copper recovery was 64% and 58.8% from mine dewatering and leach pile AMD respectively. On the other hand, elution of bound metals from Lewatit TP 220 resins resulted in the elution of metals except copper both in centrifuged (Fig. 8 and S6 ESI†) and non-centrifuged solutions (Fig. S7C, F and S8, ESI†) and therefore under the used conditions, resin could not be regenerated for re-use. From the resins that eluted copper at pH 1, the most purified copper solutions were obtained from GA-PEI resins where contamination due to other metals was less than 15% in comparison to 40–60% from the Purolite S930 Plus resins (Fig. 9). Upon comparing percentage copper recovery between mine dewatering and leach pile AMD for the same volume of solution and mass of GA-PEI resin, more copper was recovered from the leach pile solution. This could be due to a comparatively higher copper concentration in the leach pile AMD which saturates binding sites in the GA-PEI resin leading to more binding and subsequent recovery. This study thus concludes the significance of GA-PEI resins to be efficient and selective in removing copper in the presence of co-existing metal rich complex systems and also suggests reusability over large number of sorption–desorption cycles without any loss of performance efficiency.
Fig. 9. Bar graphs showing normalized metal percent recovery in eluates from centrifuged (A) mine dewatering AMD and (B) leach pile AMD post second elution cycle for GA-PEI (black) and Purolite S930 resin (grey). Error bars indicate ±min/max (n = 2).
Conclusions
Enhanced copper adsorption capacity per unit mass of the GA-PEI resin was achieved. The water permeable, porous structure of the GA-PEI resin facilitates mass-transport and copper adsorption. Copper uptake was rapid with 77% of the active sites in the GA-PEI resin being saturated with copper in the first 15 minutes. When employed in mix-metal rich industrial AMD solutions, GA-PEI resin preferentially scavenged copper ions and outperformed commercial resins Purolite S930 and Lewatit TP 220 in terms of selectivity. Furthermore, even in the presence of highly competing co-existing metals like aluminium and iron in concentrations far greater in the uptake solution, eluate chiefly contained copper. The GA-PEI resin revealed the maximum percentage recovery compared to the commercial resins. This study therefore suggests that GA-PEI resin holds great potential to be used as an environmentally safe reagent to purify as well as remediate complex real life solutions for copper. Ongoing efforts involve the optimization of this process and producing material with particle size and porosity suitable for use in columns so that AMD solutions could be treated in large volumes to produce high purity solutions in terms of copper, without dismantling the columns. Further optimization may increase the capacity per unit mass of the material with more effective removal of the underlying template.
Conflicts of interest
There are no conflicts to declare.
Supplementary Material
Acknowledgments
The project is supported by the Premier's Research and Industry Fund grant provided by the South Australian Government Department of State Development. The authors thank Christopher Bassel, Future Industries Institute, University of South Australia for XPS measurements.
Electronic supplementary information (ESI) available. See DOI: 10.1039/c8ra00454d
References
- Calvo G. Mudd G. Valero A. Valero A. Resources. 2016;5:36. doi: 10.3390/resources5040036. [DOI] [Google Scholar]
- Northey S. Mohr S. Mudd G. Weng Z. Giurco D. Resour., Conserv. Recycl. 2014;83:190–201. doi: 10.1016/j.resconrec.2013.10.005. [DOI] [Google Scholar]
- Harmsen J. H. M. Roes A. L. Patel M. K. Energy. 2013;50:62–73. doi: 10.1016/j.energy.2012.12.006. [DOI] [Google Scholar]
- Falagán C. Grail B. M. Johnson D. B. Miner. Eng. 2017;106:71–78. doi: 10.1016/j.mineng.2016.10.008. [DOI] [Google Scholar]
- Ali S. H. Giurco D. Arndt N. Nickless E. Brown G. Demetriades A. Durrheim R. Enriquez M. A. Kinnaird J. Littleboy A. Nature. 2017;543:367–372. doi: 10.1038/nature21359. [DOI] [PubMed] [Google Scholar]
- Hamdaoui O. J. Dispersion Sci. Technol. 2017;38:1087–1091. doi: 10.1080/01932691.2016.1225261. [DOI] [Google Scholar]
- Harmsen J. Roes A. Patel M. K. Energy. 2013;50:62–73. doi: 10.1016/j.energy.2012.12.006. [DOI] [Google Scholar]
- Petrov S. Nenov V. Desalination. 2004;162:201–209. doi: 10.1016/S0011-9164(04)00043-8. [DOI] [Google Scholar]
- Molinari R. Poerio T. Argurio P. Chemosphere. 2008;70:341–348. doi: 10.1016/j.chemosphere.2007.07.041. [DOI] [PubMed] [Google Scholar]
- Peng C. Liu Y. Bi J. Xu H. Ahmed A.-S. J. Hazard. Mater. 2011;189:814–820. doi: 10.1016/j.jhazmat.2011.03.034. [DOI] [PubMed] [Google Scholar]
- Lazaridis N. K. Peleka E. N. Karapantsios T. D. Matis K. A. Hydrometallurgy. 2004;74:149–156. doi: 10.1016/j.hydromet.2004.03.003. [DOI] [Google Scholar]
- Peng C. Chai L.-Y. Tang C.-J. Min X.-B. Ali M. Song Y.-X. Qi W.-M. J. Chem. Technol. Biotechnol. 2017;92:325–333. doi: 10.1002/jctb.5009. [DOI] [Google Scholar]
- Fu F. Wang Q. J. Environ. Manage. 2011;92:407–418. doi: 10.1016/j.jenvman.2010.11.011. [DOI] [PubMed] [Google Scholar]
- Deliyanni E. A. Kyzas G. Z. Matis K. A. J. Mol. Liq. 2017;225:260–264. doi: 10.1016/j.molliq.2016.11.069. [DOI] [Google Scholar]
- Barakat M. A. J. Colloid Interface Sci. 2005;291:345–352. doi: 10.1016/j.jcis.2005.05.047. [DOI] [PubMed] [Google Scholar]
- Wu J.-Y. Chen W.-S. Chang F.-C. Tsai M.-S. Desalin. Water Treat. 2014;52:683–690. doi: 10.1080/19443994.2013.826404. [DOI] [Google Scholar]
- Nosrati A. Larsson M. Lindén J. B. Zihao Z. Addai-Mensah J. Nydén M. Int. J. Miner. Process. 2017;166:29–36. doi: 10.1016/j.minpro.2017.07.001. [DOI] [Google Scholar]
- Miklavcic S. J. Nydén M. Lindén J. B. Schulz J. RSC Adv. 2014;4:60349–60362. doi: 10.1039/C4RA10370J. [DOI] [Google Scholar]
- Lindén J. B. Larsson M. Coad B. R. Skinner W. M. Nydén M. RSC Adv. 2014;4:25063–25066. doi: 10.1039/C4RA02223H. [DOI] [Google Scholar]
- Lindén J. B. Larsson M. Kaur S. Skinner W. M. Miklavcic S. J. Nann T. Kempson I. M. Nydén M. RSC Adv. 2015;5:51883–51890. doi: 10.1039/C5RA08029K. [DOI] [Google Scholar]
- Lindén J. B. Larsson M. Kaur S. Nosrati A. Nydén M. J. Appl. Polym. Sci. 2016;133(37):APP43954. doi: 10.1002/app.43954. [DOI] [Google Scholar]
- Kaur S. Kempson I. M. Lindén J. B. Larsson M. Nydén M. Biofouling. 2017:1–11. doi: 10.1080/08927014.2017.1284204. [DOI] [PubMed] [Google Scholar]
- Larsson M. Lindén J. B. Kaur S. Le Cerf B. Kempson I. Powder Diffr. 2017;32(suppl. S2):S28–S32. doi: 10.1017/S0885715617000756. [DOI] [Google Scholar]
- Qian Q. Huang X. Zhang X. Xie Z. Wang Y. Angew. Chem., Int. Ed. 2013;52:10625–10629. doi: 10.1002/anie.201305003. [DOI] [PubMed] [Google Scholar]
- Zheng X. Shen G. Wang C. Li Y. Dunphy D. Hasan T. Brinker C. J. Su B.-L. Nat. Commun. 2017;8:14921. doi: 10.1038/ncomms14921. [DOI] [PMC free article] [PubMed] [Google Scholar]
- Ma A. Xu J. Zhang X. Zhang B. Wang D. Xu H. Sci. Rep. 2014;4:6005. [Google Scholar]
- Sirola K. Laatikainen M. Lahtinen M. Paatero E. Sep. Purif. Technol. 2008;64:88–100. doi: 10.1016/j.seppur.2008.08.001. [DOI] [Google Scholar]
- Sirola K., Chelating Adsorbents in Purification of Hydrometallurgical Solutions, Lappeenranta University of Technology, 2009 [Google Scholar]
- Tsai W.-T. Hsien K.-J. Lai C.-W. Ind. Eng. Chem. Res. 2004;43:7513–7520. doi: 10.1021/ie0400651. [DOI] [Google Scholar]
- Jendoubi F. Mgaidi A. El Maaoui M. Can. J. Chem. Eng. 1997;75:721–727. doi: 10.1002/cjce.5450750409. [DOI] [Google Scholar]
- Korunic Z. J. Stored Prod. Res. 1998;34:87–97. doi: 10.1016/S0022-474X(97)00039-8. [DOI] [Google Scholar]
- Seidel H. Csepregi L. Heuberger A. Baumgärtel H. J. Electrochem. Soc. 1990;137:3612–3626. doi: 10.1149/1.2086277. [DOI] [Google Scholar]
- Sato K. Shikida M. Matsushima Y. Yamashiro T. Asaumi K. Iriye Y. Yamamoto M. Sens. Actuators, A. 1998;64:87–93. doi: 10.1016/S0924-4247(97)01658-0. [DOI] [Google Scholar]
- Larsson M. Nosrati A. Kaur S. Wagner J. Baus U. Nydén M. Heliyon. 2018;4:e00520. doi: 10.1016/j.heliyon.2018.e00520. [DOI] [PMC free article] [PubMed] [Google Scholar]
Associated Data
This section collects any data citations, data availability statements, or supplementary materials included in this article.


