An official website of the United States government
Here's how you know
Official websites use .gov
A
.gov website belongs to an official
government organization in the United States.
Secure .gov websites use HTTPS
A lock (
) or https:// means you've safely
connected to the .gov website. Share sensitive
information only on official, secure websites.
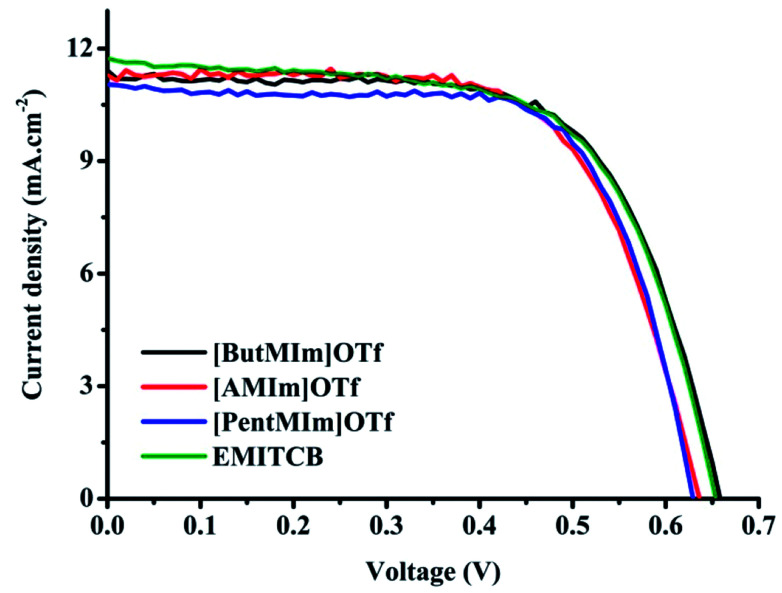
 ); [ButMIm]OTf (
 ); [AMIm]OTf (
 ) and EMITCB (
 ) under the light intensity of 1000 W m−2. The electrolyte composition: 0.05 M I2, 0.1 M PMII, 0.6 M GuNCS, 0.5 M NBB, and either one of these four ionic liquids.