. 2018 Apr 24;8(27):15229–15240. doi: 10.1039/c8ra02090f

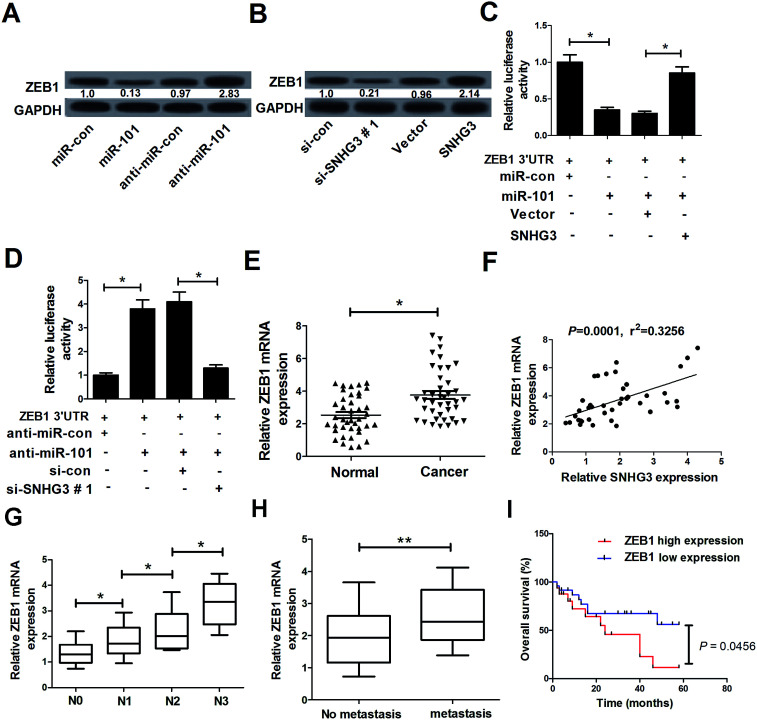
Fig. 4. The interaction between SNHG3, ZEB1 and miR-101 in breast cancer cells. (A) Western blot analysis of the ZEB1 level in MCF-7 cells transfected with miR-101, anti-miR-101, or matched controls. (B) Western blot analysis of the ZEB1 level in MCF-7 cells introduced to si-SNHG3#1, SNHG3, or the respective controls. (C) MCF-7 cells were cotransfected with ZEB1 3′-UTR and miR-101, miR-con, miR-101 + Vector, or miR-101 + SNHG3. A luciferase reporter assay was performed to detect the luciferase activity at 48 h post-transfection. (D) MCF-7 cells were cotransfected with ZEB1 3′-UTR and anti-miR-101, anti-miR-con, anti-miR-101 + si-con, or anti-miR-101 + si-SNHG3. A luciferase reporter assay was performed to measure the luciferase activity at 48 h post-transfection. (E) ZEB1 mRNA expression in 42 paired breast cancer tissues and adjacent normal tissues. (F) The correlation between SNHG3 and ZEB1 mRNA expression in breast cancer tissues. (G) The expression of ZEB1 in different advanced pathological stages N0, N1, N2 and N3. (H) The expression of ZEB1 in 31 breast cancer patients with distant metastasis and 11 breast cancer patients with no distant metastasis. (I) Kaplan–Meier curves and a log-rank test of overall survival for all breast cancer patients. *P < 0.05, **P < 0.01.

Fig. 4