. 2018 Apr 30;8(29):16114–16125. doi: 10.1039/c8ra00819a

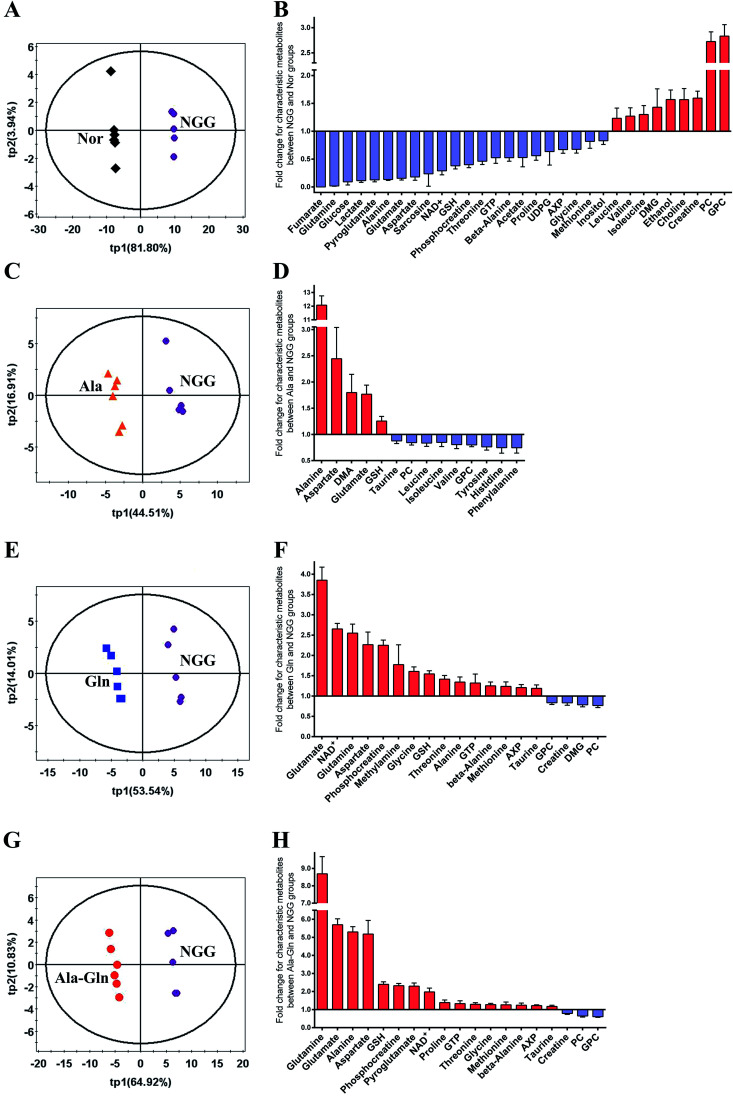
Fig. 4. PLS-DA analysis for identifying significant metabolites primarily responsible for discriminations of metabolic profiles between the NGG group and other four groups. (A, C, E and G) PLS-DA scores plots for NGG vs. Nor (A), Ala vs. NGG (C), Gln vs. NGG (E), Ala-Gln vs. NGG (G). Differential metabolites were identified by student's t-test analysis based on the significant metabolites. Thereafter, characteristic metabolites were identified by a combination of the significant metabolites and differential metabolites. (B, D, F and H) Fold changes of characteristic metabolite levels for comparisons between NGG vs. Nor (B), Ala vs. NGG (D), Gln vs. NGG (F), Ala-Gln vs. NGG (H).

Fig. 4