. 2018 May 3;8(30):16420–16432. doi: 10.1039/c8ra01489b

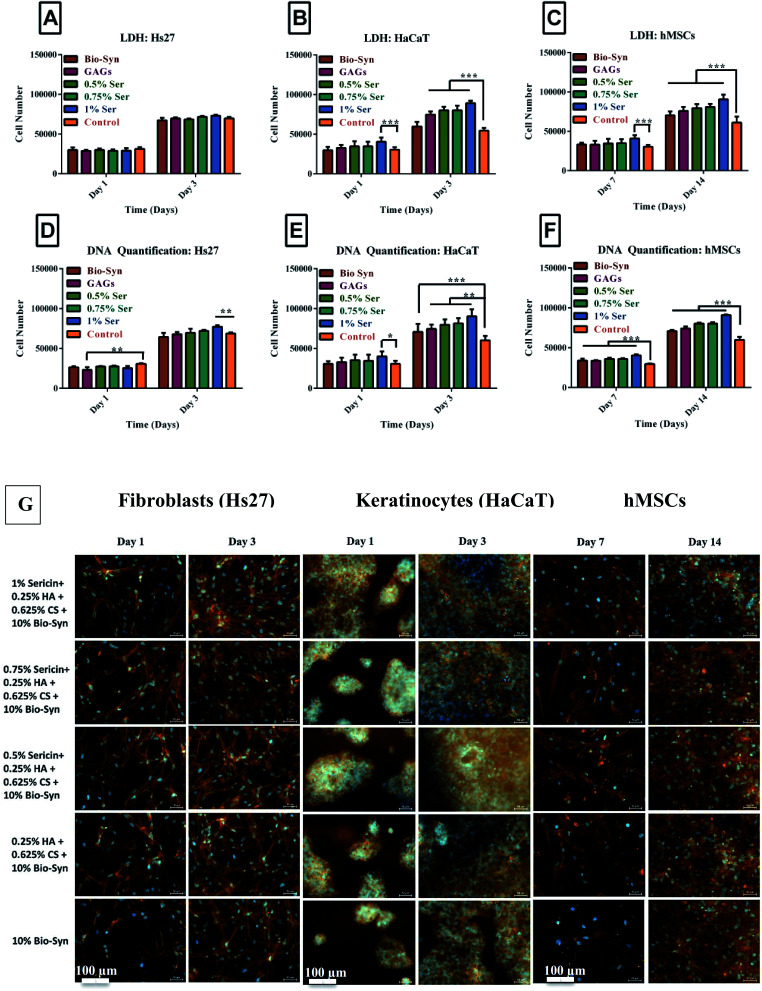
Fig. 3. Cellular proliferation shown by LDH assay on (A) Hs27 cells, (B) HaCaT cells, and (C) hMSCs; and by Pico Green dsDNA quantification assay on (D) Hs27 cells, (E) HaCaT cells, and (F) hMSCs. (G) Fibroblast, keratinocyte and hMSC cultured Bio-Syn scaffolds were immunostained (red-orange) at the cytoskeleton with Alexa Fluor 564 Phalloidin and at the nucleus (blue) with DAPI. The 10% Bio-Syn composite scaffold served as a control. The data presented in this figure are in terms of the mean ± SD. In this figure, the abbreviations used are (i) Bio-Syn: 10% Bio-Syn composite scaffold, (ii) GAGs: 0.25% HA + 0.625% CS + 10% Bio-Syn, (iii) 0.5% Ser: 0.5% sericin + 0.25% HA + 0.625% CS + 10% Bio-Syn, (iv) Ser: 0.75% sericin + 0.25% HA + 0.625% CS + 10% Bio-Syn and (v) 1% Ser: 1% sericin + 0.25% HA + 0.625% CS + 10% Bio-Syn. 10 mm coverslips coated with collagen were examined as a control. (n = 8); *p < 0.05, **p < 0.01, ***p < 0.001 scaffold groups.

Fig. 3