Figure 4.
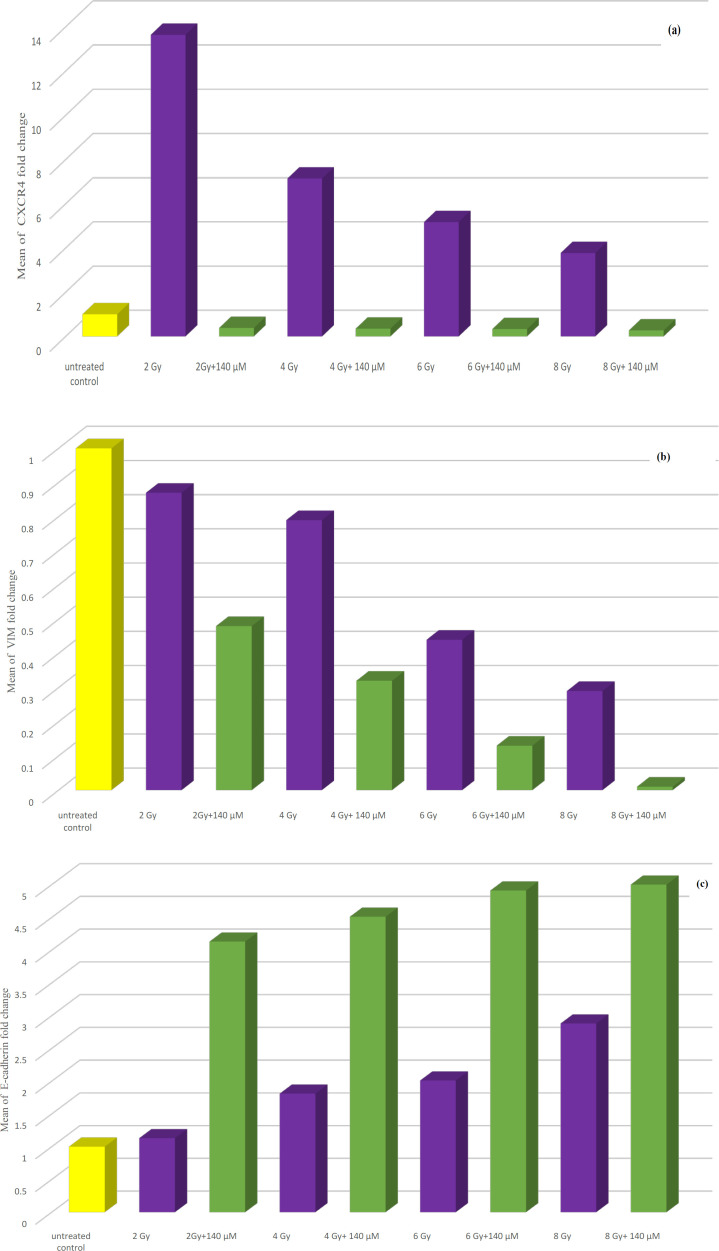
(a) Bar chart illustrating the effect of combination treatment of both ionizing radiation and resveratrol at IC50 (140 µM) on CXCR4 gene expression in PC-3 cell line. (b) Bar chart illustrating the effect of combination treatment of both ionizing radiation and resveratrol at IC50 (140 µM) on VIM gene expression in PC-3 cell line. (c) Bar chart illustrating the effect of combination treatment of both ionizing radiation and resveratrol at IC50 (140 µM) on E-cadherin gene expression in PC-3 cell line

