. 2018 May 22;8(33):18647–18655. doi: 10.1039/c8ra02946f

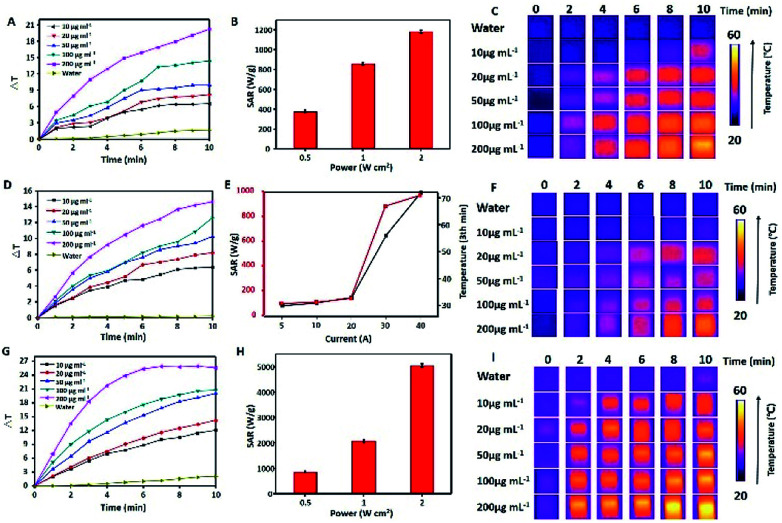
Fig. 3. Photothermal and magnetic hyperthermia performance of MPB NPs. The temperature change curves of solutions with water and different MPB NPs concentrations after 808 nm NIR laser irradiation (A) and AC field (500 kHz, 12 kA m−1) (D); SAR vs. laser power density (B) and AC magnetic field (E) curves obtained from 0.2 mg mL−1 MPB NPs, in image (E) the black curve illustrated the temperature change of MPB after 3 min. IR thermal images of the water and MPB NPs suspensions at various concentrations upon NIR irradiation (C) and AC magnetic field (500 kHz, 12 kA m−1) (F). The temperature change curves (G), SAR vs. laser power density and AC magnetic field (H) and IR thermal images (I) under the dual-modal heating effect.

Fig. 3