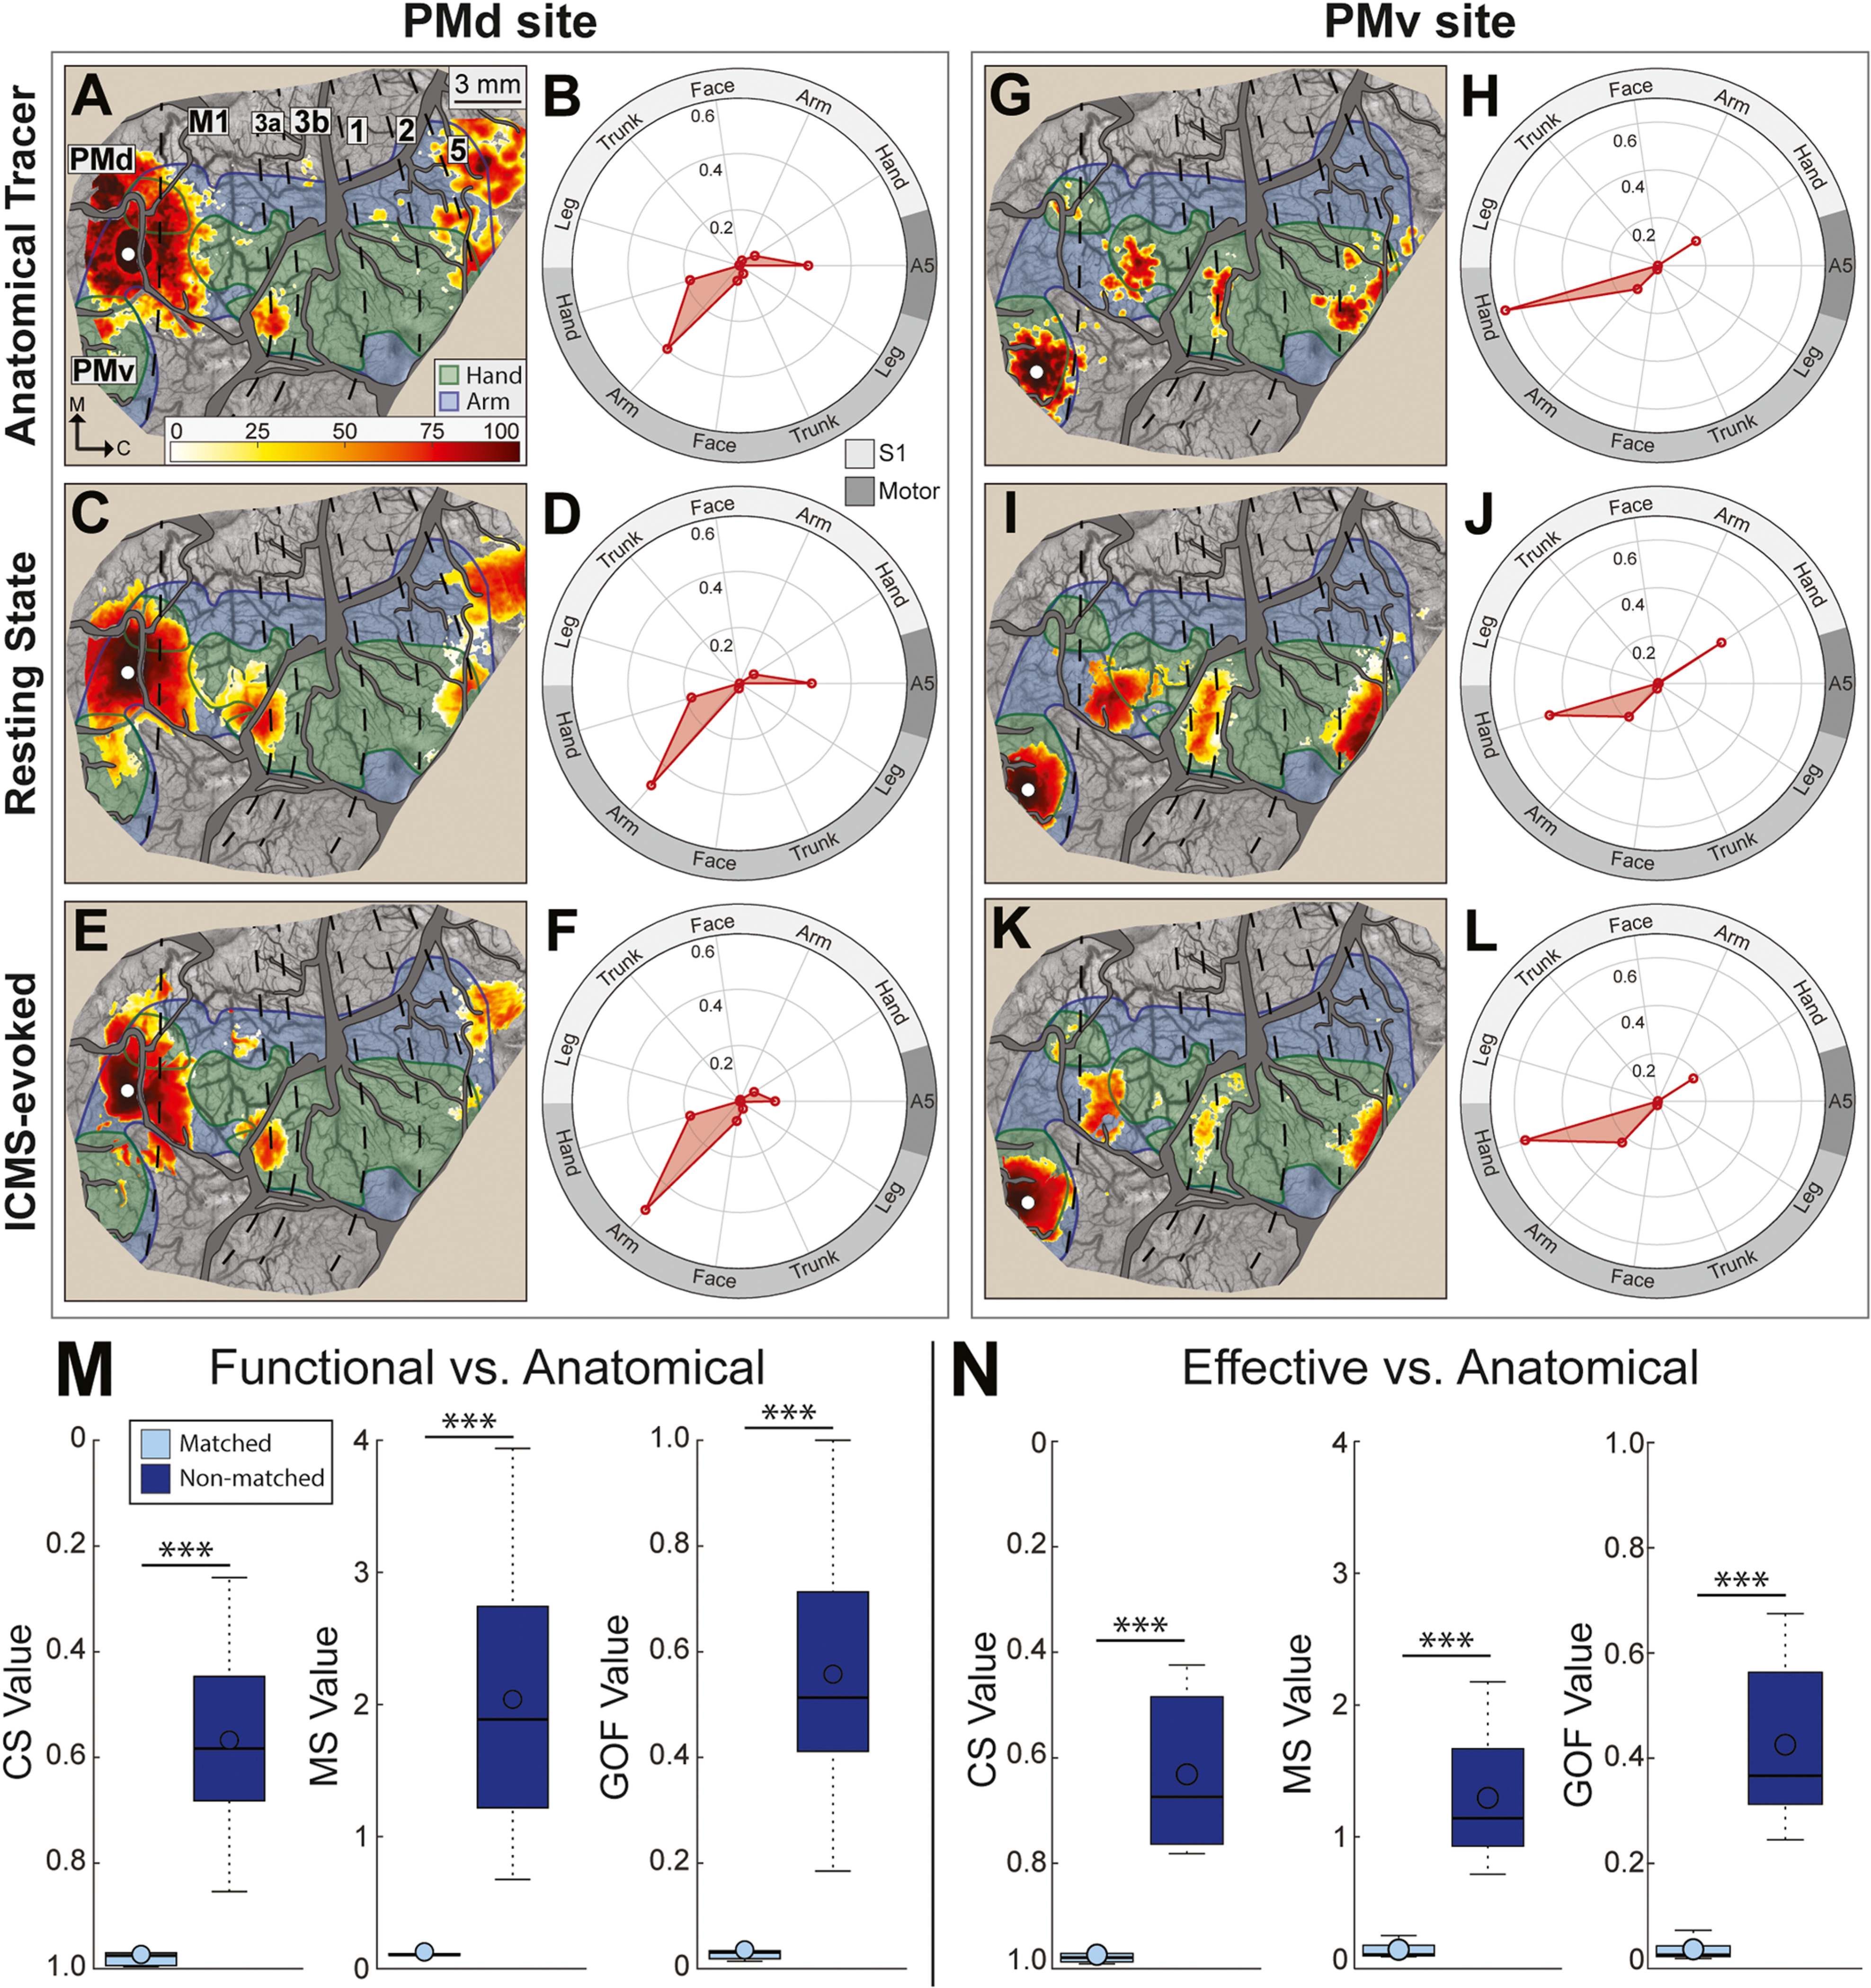
Fig. 6.

Functional and effective connectivity maps correspond with anatomical connectivity maps. (A-F) Comparison of FC, EC, and AC maps for a site in the PMd arm zone (monkey R). Conventions are consistent with Fig. 4 & Fig. 5. Color bar applies to all maps. Note similarities between the 3 maps and the 3 polar plots. (A-B) AC map and corresponding quantitative profile (5 sections, 50,020 CTB-labeled cells). (C-D) FC map and quantitative profile. (E-F) EC map and quantitative profile. (G-L) Same as (A-F), but for a site in the PMv hand zone. Note similarities between the 3 maps and the 3 polar plots. AC map in (G) was based on 6 sections, 1,878 BDA-labeled cells. (M) Cosine similarity (CS), mean separation (MS), and goodness of fit (GOF) for pairwise comparisons of FC maps and AC maps from matched (light blue) and non-matched (dark blue) sites. Matched comparisons showed more correspondence between FC and AC maps than non-matched comparisons. (N) Matched comparisons showed more correspondence between EC and AC maps than non-matched comparisons.
