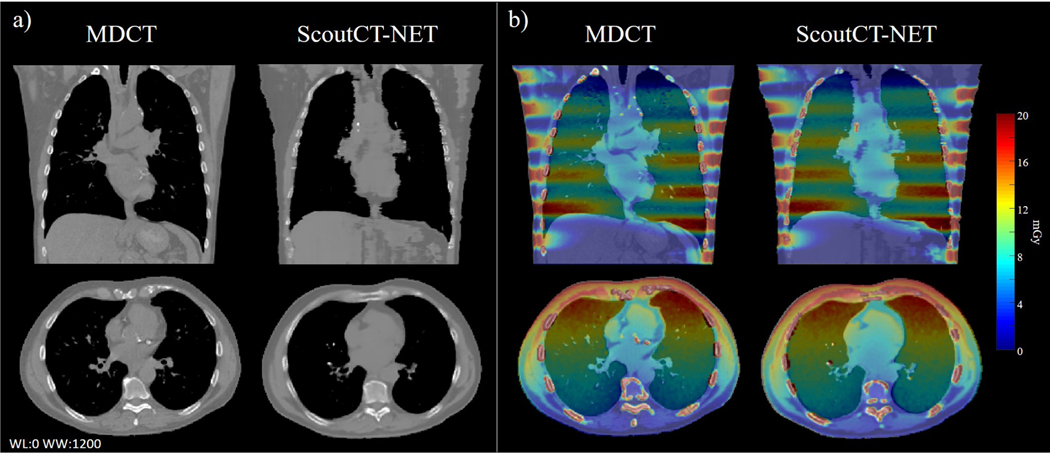
Figure 3:
(a) Coronal and axial slices through the ScoutCT-NET 3D patient attenuation model and the corresponding CT images. (b) Comparison of the spatial distribution of absorbed doses from a virtual helical CT scan delivered to the ScoutCET-NET attenuation model with those to the CT-based attenuation model. 96.0% of the voxels had a gamma value ≤ 1 based on the Δdm = 5mm distance to agreement and ΔDm = 10% criterion.

