
Figure 2.
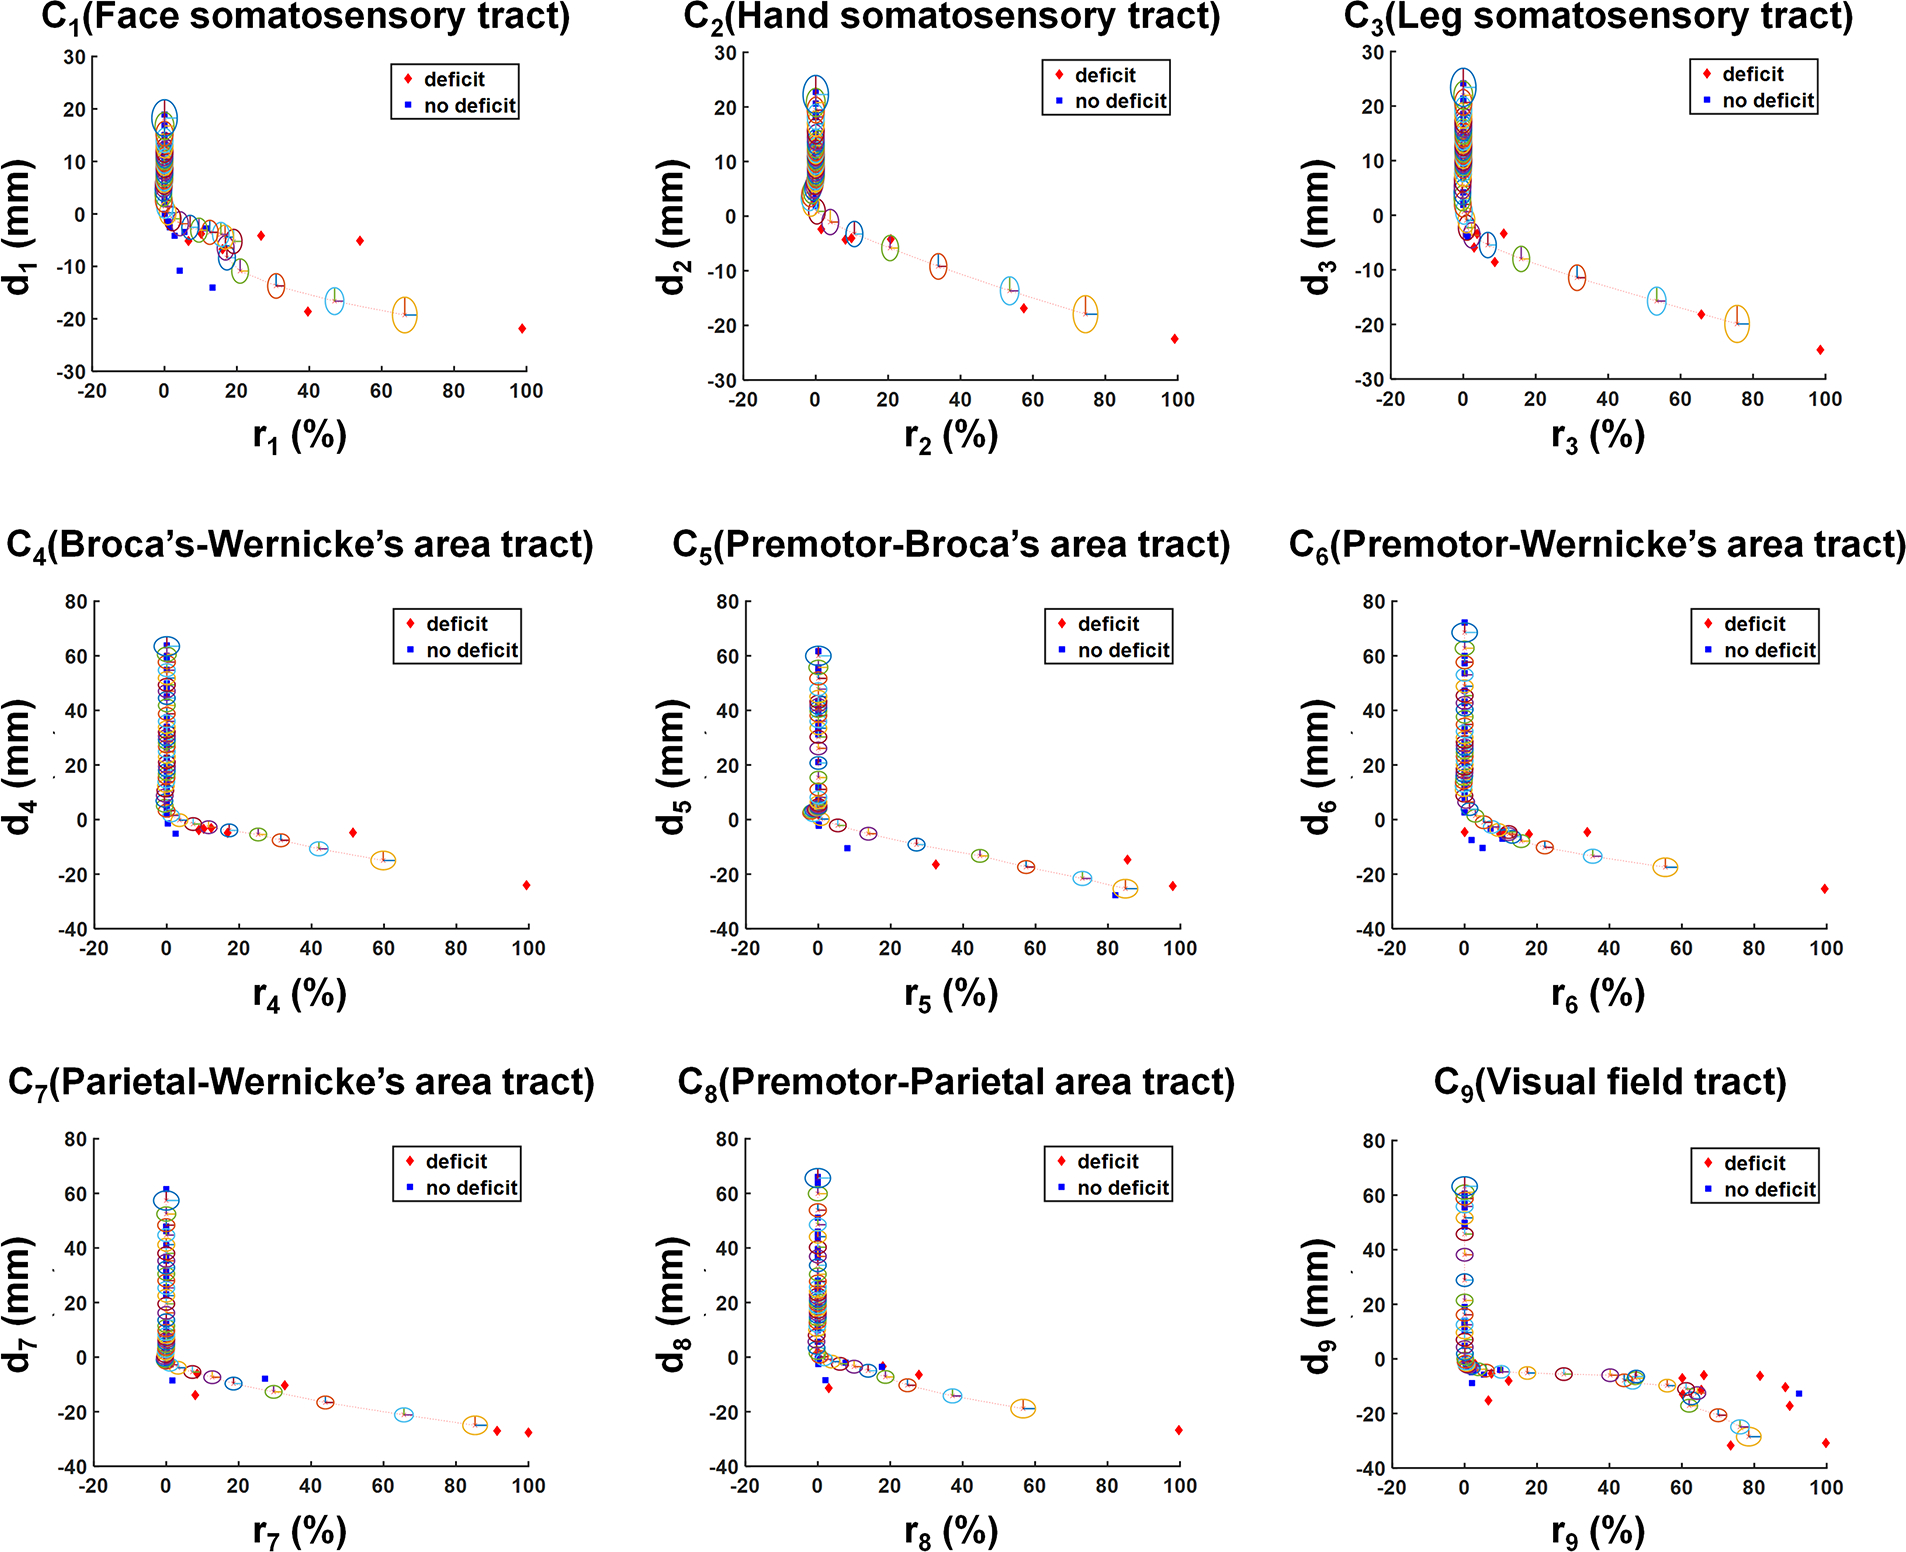
2D plots showing the hidden relationship between resection margin, di, and postoperative volume changes of Ci, ri, which were measured in pre- and postoperative DWI data of the modeling dataset (Supplemental Table 1, n = 40). In each plot, red diamonds and blue squares indicate patients with and without postoperative deficit, respectively. Kalman filter prediction using the Rauch-Tung-Striebel algorithm27 was applied to fit di as a function of a dynamic variable ri, resulting in di(ri) (red dotted line). The radius of each colored ellipsis indicates the covariance of the state variable x(ri), approximating the 95% CI of di(ri).