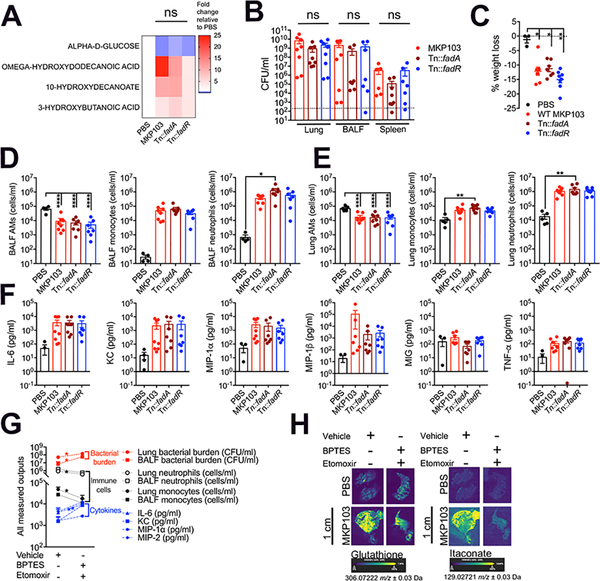
Figure 2. Host metabolic responses to infection predominantly dictate the airway metabolome.
(A) Heatmap showing BALF metabolites from mice treated intranasally with PBS (n = 5 mice), WT MKP103 (n = 5 mice) or transposon mutants impaired in bacterial fatty acid oxidation (Tn::fadA, n = 5 mice) and synthesis (Tn::fadR, n = 5 mice) 48 h earlier. The above-mentioned total number of mice per group were from 2 independent experiments. The level of each metabolite in response to the different stimuli is compared by fold increase over the uninfected control (PBS); ns: not significant.
(B) Bacterial burden from the lung, BALF and spleen of WT BL/6 mice infected with MKP103 (n = 8 mice), Tn::fadA (n = 8 mice) or Tn::fadR (n = 8 mice) 48 h earlier. The above-mentioned total number of mice per group were from 3 independent experiments. The dotted line indicates the limit of detection.
(C) Percentage of murine body weight loss 48 h post treatment.
(D-E) Innate immune cells (alveolar macrophages (AMs), monocytes and neutrophils) from the (D) BALF and (E) lungs of uninfected (PBS, n = 5 mice from 3 independent experiments) and infected mice (same number of replicates as in (B)) at 48 h pi.
(F) Cytokine measurements from the BALF of uninfected and infected mice at 48 h pi.
(G) Bacterial burden and host immune cells and cytokines from the airway of mice infected with MKP103 48 h earlier and treated with BPTES and etomoxir (n = 6 mice) or the vehicle control (n = 8 mice). The above-mentioned total number of mice per group were spread across 2 independent experiments.
(H) DESI-MS spectral images of GSH and itaconate in 10 μm lung sections from uninfected (n = 1 technical replicate of 1 biological sample) and MKP103-infected (n = 1 technical replicate of 1 biological sample) mice (48 h post infection, pi) treated with BPTES and etomoxir or the vehicle control. Scale bar (H): 1cm.
The data represent mean values ± SEM, statistical analysis for (A), (C-F) and (B), (G) was performed by one-way ANOVA; *P < 0.05, **P < 0.01, ***P < 0.001, ***P < 0.0001 and Mann Whitney non-parametric U-test, *P < 0.05, **P < 0.01, respectively.

