Abstract
The polyol process is a widely used strategy for producing nanoparticles from various reducible metallic precursors; however, it requires a bulk polyol liquid reaction with additional protective agents at high temperatures. Here, we report a water-based binary polyol process using low concentrations of high-molecular-weight polyethylene glycol (100 000 g mol−1, 2 wt%) and ethylene glycol (5 wt%). The entangled conformation of the polyethylene glycol in water and the increased number of reducing sites by the ethylene glycol cooperatively contributed to the stability and effectiveness of reduction reaction and particle growth, producing uniformly sized silver nanoparticles (15.8 ± 2.2 nm) with no additional protective agents at a mild temperature of 80 °C. The measurement of particle size throughout the reaction and the dependence of the optical density of a silver colloidal solution on the concentration of ethylene glycol revealed three stages of particle growth. The minimum inhibitory concentrations of the purified silver nanoparticles against four representative human and foodborne pathogenic bacteria—S. aureus, P. aeruginosa, S. enterica, and E. coli—were 4.7, 2.3, 2.3, and 1.2 μg mL−1, respectively.
A water-based binary polyol process, where the entangled conformation of polyethylene glycol activated the reduction reaction of ethylene glycol and stabilized the particle growth, produced silver nanoparticles with enhanced antibacterial property.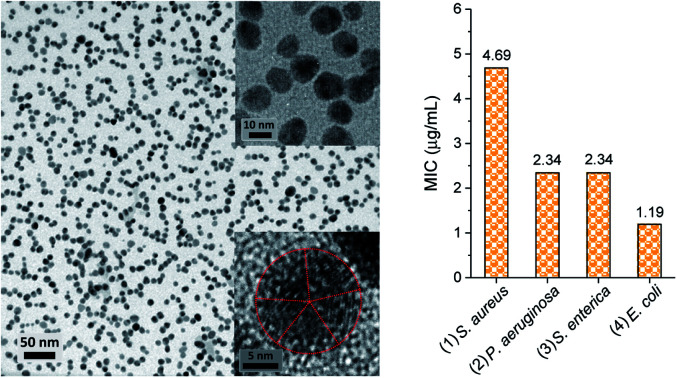
1. Introduction
The polyol process is a versatile method for producing fine metallic particles using a poly-alcohol, mainly ethylene glycol, as both a solvent and reducing agent.1 The general mechanism for this process involves the dissolution of metallic precursors in the polyol liquid and the reduction of metallic cations through an oxidation of the hydroxyls or a duplicative oxidation of acetaldehyde, followed by the precipitation reactions—nucleation and particle growth. Due to its rather high dielectric constant, ethylene glycol readily dissolves many metal salts and acts as a growing medium, generating particles in micrometer and submicrometer sizes.1,2 With the aid of protective agents and by controlling for other factors such as temperature and the concentration ratios of reagents, it is possible to lower the particle size to nanometer scale. As a result, a wide spectrum of metallic and bimetallic nanoparticles, including Ag, Au, Fe, Co, Pt, Fe–Pt, and Au–Pd, have been extensively produced during the last two decades using this polyol technique.3–8 In addition to ethylene glycol, low-molecular-weight polyethylene glycol melts (200–600 g mol−1) were also found to have the capacity to form silver nanoparticles.9,10 The reducing capability of polyethylene glycol and the size of the resulting particles depended heavily on its molecular weight and the reaction temperature. Liquid polyethylene glycol with a low vapor pressure was also used as a capture medium in the sputter deposition for synthesizing Ag and Au nanoparticles.11,12
The polyol process with ethylene glycol generally requires high temperatures (160–298 °C), because at mild temperatures its reducing reactivity is very weak. For example, at 80 °C, no silver nanoparticles were formed within 1 hour,9 and particle formation at 120 °C (ref. 13) and 27 °C (ref. 14) took 22 hours and 67 hours, respectively. Therefore, additional reducing agents have been employed to facilitate the reduction reaction.15 Moreover, ethylene glycol's inability to inhibit the coagulation of nanoparticles necessitates the addition of stabilizers such as surfactants, polymers, or ligands; an ethylene glycol-poly(vinylpyrrolidone) system has been well established.3,8,13–15 The difficulty of balancing the need to control against the need to promote the reaction persisted in the use of low-molecular-weight polyethylene glycol melts as well. Controlling the reaction and thus particle size by lowering the temperature resulted in incomplete reduction, whereas elevating the temperature to facilitate the reaction resulted in the formation of large, irregular particles.9 Furthermore, the use of bulk polyol liquid and additional protective agents, which requires multiple washing to recover nanoparticles, would complicate the application of the process in large-scale production in terms of cost and adverse impacts on the environment. In an effort to develop an easier and more environmentally friendly polyol process, we previously introduced a water-based polyol process using a high-molecular-weight polyethylene glycol (100 000 g mol−1) (PEG 100) as a reducing and protective agent.16 Its coiled conformation in water played important roles in inducing the reduction reaction and stabilizing particle growth, consequently producing monodispersed silver nanoparticles with no protective agents at a mild temperature (80 °C). Under the same condition, lower-molecular-weight polyethylene glycols (2000 and 35 000 g mol−1), which failed to form the entangled conformation, could not produce silver nanoparticles.
Many studies have agreed that tuning the morphology of nanoparticles by the controlled synthesis is important to improve their properties. The dependence of the antibacterial property of silver nanoparticles on size, size distribution, and shape is associated with their biocidal mechanisms. First, silver nanoparticles are a source of antibacterial silver ions. Through desorption from particle surfaces or the oxidation of zero-valent silver under oxic conditions, silver ions are released into the environmental media.17–19 The released silver ions interact with the functional groups (e.g., thiol groups) of proteins and other cell constituents and cause the K+ loss from the membrane. These activities lead to overall functional defects in the microorganism.20–23 Silver ions are also known to interact with DNA and disable its ability to replicate. Second, in addition to the function of silver ions, silver nanoparticles themselves exert cellular toxicity by direct physical attack. This process includes the penetration of nanoparticles into the cell and binding onto the surfaces of the cell wall and membrane.24–27 As a result of such multiple mechanisms, smaller particles with narrower size distribution and shapes with larger surface areas (e.g., truncated octahedral), which promote the release of bioactive silver ions and the nanophysical attack, further enhance biocidal performance.17,26,28–32
This study was conducted with the main objective of developing a more effective, size-tunable water-based polyol process to enhance the antibacterial property of silver nanoparticles. In a previous publication,16 we demonstrated that PEG 100 alone enabled to chelate silver ions in water to produce silver nanoparticles. However, due to the small number of hydroxyl terminal groups, PEG 100 has limited reducing capability. To increase the number of reducing sites, the present work introduces a binary polyol process by blending ethylene glycol or low-molecular-weight polyethylene glycols (400 and 2000 g mol−1) with PEG 100. The greater effectiveness of this modified polyol process was examined by references to the optical density of colloidal solutions and the measurement of particle size as a function of reaction time. The effect of the concentration of ethylene glycol on the optical response of the colloidal solution helped advance our understanding of the particle formation mechanism in the polyol process, explanation of which was incomplete in the literature. The antibacterial activities of purified silver nanoparticles against four human and foodborne pathogenic bacteria—S. aureus, P. aeruginosa, S. enterica, and E. coli—were evaluated by measuring their minimum inhibitory concentrations (MICs).
2. Experimental
2.1. Materials
Silver nitrate (AgNO3, 99.9%) was purchased from J. T. Baker. Ethylene glycol (99.8% denoted as EG) and polyethylene glycols of three molecular weights (M = 400, 2000, and 100 000 g mol−1 denoted as PEG 0.4, PEG 2, and PEG 100, respectively) were purchased from Sigma-Aldrich (St. Louis, MO). All chemicals were used without further purification. Deionized (DI) water was used as the solvent.
2.2. Synthesis of silver nanoparticles
PEG 100 (2 g, 0.02 mmol based on number-average molecular weight) was dissolved in DI water (98 g) to prepare a 2 wt% solution. This aqueous solution was filtered using Whatman No. 5 filtration paper and blended with EG or low-molecular-weight PEGs (PEG 0.4 or PEG 2) of various weight ratios. The prepared solution was then transferred to a three-neck round-bottom flask with a stir bar. The three necks of the flask were fitted with a swan-neck adapter that supported a thermometer, a reflux condenser, and a rubber septum. AgNO3 (0.05 g, 0.29 mmol) was dissolved in 25 g of DI water in a separate flask at room temperature. While we kept the temperature of the binary blend solution constant at 80 °C, the AgNO3 solution was added dropwise using a syringe pump (model 210, Kd Scientific) with a flow rate of 1 mL min−1. After the AgNO3 solution had been added completely, the reaction was allowed to proceed under constant stirring at 80 °C. The time for completing the addition of the AgNO3 solution was set at 0 min of reaction. The reaction was continued for 2 h, which was long enough to observe the three stages of particle growth in EG/PEG 100 binary solutions. The reaction in an aqueous solution of PEG 100 alone was denoted as a control. Purification of extremely small silver nanoparticles was achieved using high-speed centrifugation (Ultracentrifuge, Hitachi). The reaction solution was spun at 50 000 rpm for 30 min, which led to the complete sedimentation of nanoparticles, leaving a colorless supernatant liquid. The collected particles were dispersed in DI water, spun at 30 000 rpm for 20 min, and redispersed in DI water. The synthesis was repeated twice, and the formation of silver nanoparticles was reproducible.
2.3. Characterization of silver nanoparticles
The viscosities of aqueous binary polyol solutions (EG/PEG 100 and PEG 0.4/PEG 100) at room temperature were measured with a viscometer (LVDV-II + PRO, Brookfield) equipped with a UL adaptor using a cylindrical geometry. The diameter of the stainless steel spindle was 25.2 mm, and the gap between the spindle and wall was 2.4 mm. The volume of sample measured was 16 mL. The viscosity of all samples was constant under shear rates that ranged from 12 to 73 s−1 and thus zero shear viscosity was determined.
The optical property of the colloidal silver nanoparticles obtained at various stages of the reaction was monitored using a UV-vis spectrometer (Cary 500, Varian). During the reaction, 1 mL of the solution was withdrawn using a syringe needle through the rubber septum every ten min and diluted three-fold with DI water. The three-fold dilution allowed the spectral comparison of all samples studied. The absorption spectra of the diluted solutions were recorded in a wavelength range of 200 to 800 nm using quartz curettes of 1 cm path length.
Micrographs of silver nanoparticles were obtained using a transmission electron microscope (TEM, JEOL 2010) operating at 200 kV. A drop of a purified colloidal solution was placed on a carbon-film-coated copper grid and dried. The average particle size and the size distribution of silver nanoparticles were obtained by the analysis of the TEM micrographs using Image J software.33 At least 200 particles were measured. Following the acquisition of TEM images, energy dispersive spectroscopy (EDS) and selected area electron diffraction (SAED) analyses were performed using the same accelerating voltage (200 kV).
Zeta potential and particle size distribution of silver colloidal solutions were obtained using a Nano-ZS90 zeta-sizer (Malvern Instruments Ltd., UK) equipped with a 4 mW He–Ne laser (633 nm) and 90° collecting optics. Three replicate measurements were analyzed using Malvern Dispersion Technology Software 4.20.
The concentration of silver was determined using an inductively coupled plasma mass spectrometer (ICP-MS, Agilent 7500ce). The solution was dried down to 5 mL, digested with aqua regia, evaporated, and dissolved in nitric acid. External calibration was performed.
The MICs of silver nanoparticles against four microorganisms, Gram-positive Staphylococcus aureus ATCC 6538 (S. aureus), Gram-negative Pseudomonas aeruginosa ATCC 15442 (P. aeruginosa), Gram-negative Salmonella enterica ATCC 10708 (S. enterica), and Gram-negative Escherichia coli ATCC 11229 (E. coli), were measured. Testing was conducted by Microchem Laboratory (Round Rock, TX) following the standards outlined by the Clinical and Laboratory Standards Institute. Briefly, test microorganisms were prepared in a liquid culture medium, and suspensions of test microorganisms were standardized by dilution in a Mueller-Hinton broth. The purified silver colloidal solution (150 μg mL−1) was serially diluted in a 96-well microtiter plate through the Mueller-Hinton broth. All wells were inoculated with test microorganisms individually and incubated at 36 °C ± 1 °C for 24 hours. The final well volume and dilution range were 0.2 mL and 50–0.098%, respectively. After the incubation period, the MIC was determined by identifying the lowest concentration of silver in a well where no turbidity was observed. Three replicates of the test were conducted.
3. Results and discussion
3.1. EG and low-molecular-weight PEGs
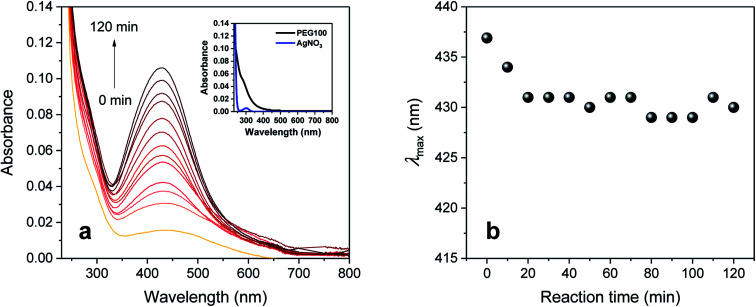
Fig. 1a shows the UV-vis spectra collected during the synthesis of silver nanoparticles in an aqueous solution of PEG 100 alone. At increments of 10 min, a sequence of spectra was obtained until the reaction time reached 120 min. All the spectra were characterized as a single peak centered at 430–437 nm, which was absent for aqueous solutions of individual PEG 100 and AgNO3 (inset of Fig. 1a). The intensity of this peak continuously increased as the reaction time increased. In accordance with the spectral change, the initial colorless solution began developing a yellow color during the introduction of AgNO3, which became darker as the reaction proceeded. The changes in UV-vis spectra and color were attributed to the plasmon resonance of silver nanoparticles generated by the interaction of their free conduction electrons with the electric field of incident light.34 The entangled conformation of PEG 100 in water chelated silver ions to induce the reduction reaction through the oxidation of its hydroxyl terminal groups to aldehyde groups and stabilized the particle growth. Fig. 1b shows the plot of the wavenumber at the maximum absorption intensity (λmax) as a function of reaction time. The λmax shifted toward lower wavelengths during the initial period of the reaction, but after 20 min it remained relatively constant at around 430 nm.
Fig. 1. (a) UV-vis absorption spectra and (b) wavelength at the maximum absorption (λmax) of silver colloid prepared in a 2 wt% aqueous PEG 100 solution at 80 °C as a function of reaction time. All absorption intensities were obtained with a three-fold dilution. The inset in (a) shows the UV-vis absorption spectra of individual PEG 100 and AgNO3 aqueous solutions.
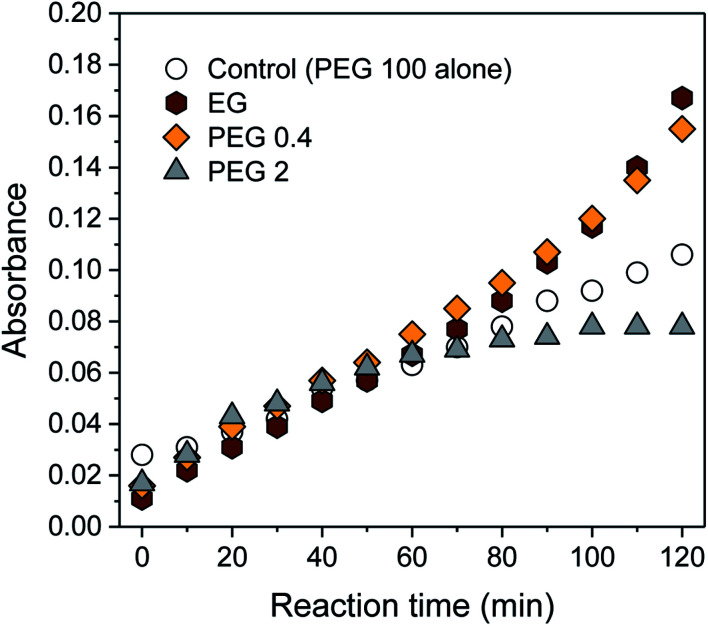
To increase the number of reduction sites (i.e., hydroxyl groups), ethylene glycol (EG) or low-molecular-weight PEGs (PEG 0.4 and PEG 2) was blended with PEG 100 (PEG 100 alone was denoted as a control). The concentrations of EG and low-molecular-weight PEGs were adjusted to have the same 10 mmol of hydroxyl groups (10, 2, and 0.3 wt% for PEG 2, PEG 0.4, and EG, respectively), which was about 34 times greater than the total number of moles of AgNO3 introduced. Fig. 2 shows the intensity at λmax obtained from control and binary solutions as a function of reaction time. During the first half of the reaction, no significant effect of extra hydroxyl groups on the absorption was observed regardless of the size of the polyol molecules. Beyond 60 min, however, the absorption intensities for EG and PEG 0.4 exceeded the intensity for the control and increased more steeply. The extent of this improvement was not significantly different between EG and PEG 0.4. On the other hand, the blend of PEG 2 suppressed the evolution of absorbance beyond 60 min, so that its intensity remained constant, keeping it below the level of control intensity.
Fig. 2. UV-vis absorption spectra of silver colloids prepared in aqueous PEG 100 and binary polyol (EG/PEG 100, PEG 0.4/PEG 100, and PEG 2/PEG 100) solutions as a function of reaction time. The concentrations of EG, PEG 0.4, and PEG2 in the corresponding binary solution were determined based on the number of moles of hydroxyl groups (10 mmol). The absorption intensities were obtained with a three-fold dilution.
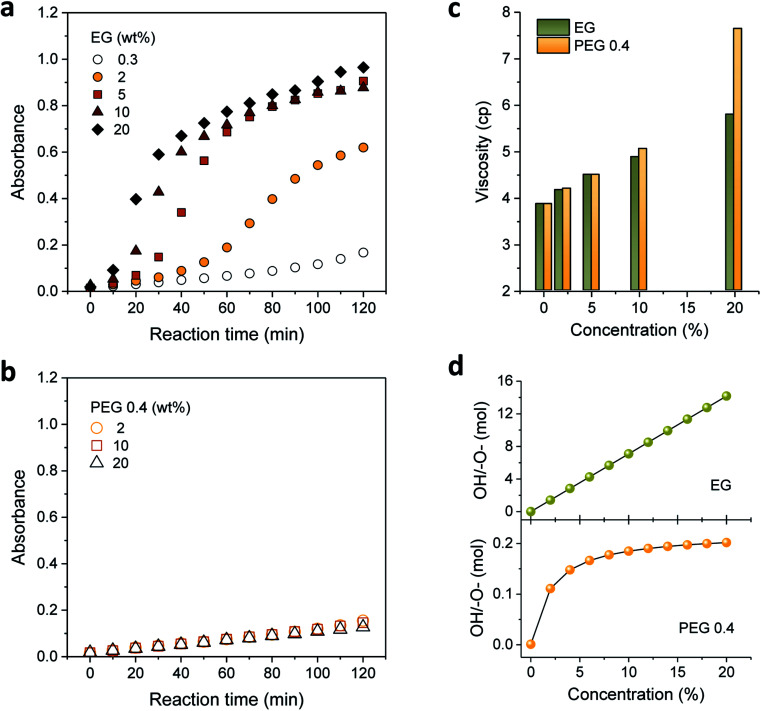
Motivated by the favorable effect of low concentrations of EG and PEG 0.4 on the formation of silver nanoparticles, their concentrations were increased. Fig. 3a and b show the UV-vis absorption spectra measured by increasing the concentrations of EG and PEG 0.4, respectively. As opposed to their spectral similarity, which was shown at low concentrations (Fig. 2), EG and PEG 0.4 exhibited considerably distinct spectra at higher concentrations. For EG, the absorbance rapidly developed as its concentration increased, particularly during the first 60 min of the reaction. The absorption intensity for PEG 0.4, however, remained almost the same throughout the entire reaction even while increasing its concentration as much as 20%.
Fig. 3. UV-vis absorption spectra of silver colloids prepared in aqueous binary polyol solutions by varying the concentrations of (a) EG and (b) PEG 0.4. The absorption intensities were obtained with a three-fold dilution. (c) Viscosity of an aqueous binary polyol solution with varying the concentrations of EG and PEG 0.4. (d) Mole ratio of hydroxyl group to ether oxygen in a binary polyol solution as a function of the concentrations of EG and PEG 0.4.
To explain such distinctive optical responses from the EG and PEG 0.4 binary polyol processes, the viscosity and mole ratio of the hydroxyl group to ether oxygen were examined by varying the concentrations of EG and PEG 0.4, as seen in Fig. 3c and d, respectively. These two binary solutions exhibit similar viscosities with a linear concentration dependence of up to 10%, indicating that the translational property of the solution was not an important contributor to their variable performance in particle formation. An abrupt increase in viscosity observed for 20% PEG 0.4 indicates the increased restriction in chain mobility, which is likely to be induced by hydrogen bonding between PEG 0.4 and PEG 100 as the concentration increased to 20%. The hydrogen bonding favored for PEG 0.4 was probably due to its conformational interactions with PEG 100. The resulting reduced accessibility to hydroxyls as reducing cites was therefore responsible for the retarded evolution of absorbance for PEG 0.4 at the later stage of the reaction (Fig. 2). This adverse chain-length effect was manifested by PEG 2, which apparently stopped the evolution of absorbance after 60 min (Fig. 2).
The mole ratio of the hydroxyl group to ether oxygen explained much of the capability of binary polyol solutions to produce silver nanoparticles. The hydroxyl groups of EG and PEG 0.4 form hydrogen bonds with the ether oxygens of PEG 100. In the case of PEG 0.4, both intra- and intermolecular hydrogen bonds with its own ether oxygens are also possible. These hydrogen complexes are expected to interrupt the oxidation of hydroxyl groups to aldehyde groups. As can be seen in Fig. 3d, the mole ratio for EG increased linearly, reaching 14 at 20%, while the mole ratio for PEG 0.4 quickly leveled off at above 2%, barely reaching 0.2. The excess of hydroxyl groups relative to ether oxygens in EG binary polyol solutions facilitated the reduction reaction of silver ions. The stabilization of the number of available hydroxyls in the PEG 0.4 binary polyol solution was considered responsible for insignificant or in obvious concentration dependence of PEG 0.4 on the formation of silver nanoparticles, as seen in Fig. 3b.
3.2. 5% EG binary polyol synthesis
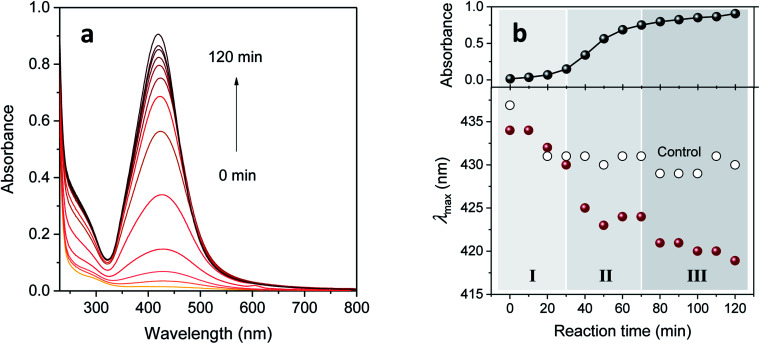
It is apparent in Fig. 3a that increasing the concentration of EG above 5% became less effective for enhancing absorbance intensity after 60 min of reaction time. We focused thereafter on the synthesis of silver nanoparticles in a 5% EG binary polyol solution. The corresponding UV-vis spectra obtained by increasing the reaction time are shown in Fig. 4a. Its evolution pattern was substantially different from that of the control (Fig. 1). In contrast to the slow, steady increase for the control, intense enhancement occurred between 30 and 70 min for the 5% EG. It is also noticeable that, while the intensity increased, the peak position shifted toward lower wavenumbers. This blue-shift, which was more obvious in the plot of λmax as a function of reaction time (as seen in Fig. 4b), was associated with the reduction of silver ions adsorbed on the surface of the nanoparticles.14
Fig. 4. (a) UV-vis absorption spectra and (b) absorbance intensity and λmax of silver colloid prepared in a 5% EG binary polyol solution as a function of reaction time. The absorption intensities were obtained with a three-fold dilution. The three stages of particle formation in (b) are depicted by varying shades of gray.
Distinctively large drops in λmax were observed at 30–40 min and 70–80 min. These step changes coincided with the slope changes in the plot of the corresponding absorbance versus reaction time, signifying the existence of three distinct stages of particle formation. Silvert et al.13 and Slistan-Grijalva et al.,14 who synthesized silver nanoparticles in a bulk EG containing PVP at 120 °C for 22 h and at 27 °C for 67 h, respectively, proposed slightly different particle formation mechanisms. Nucleation in the first stage, particle growth in the second stage, and further growth by Ostwald ripening in the third stage were proposed by Silvert et al., whereas simultaneous nucleation and particle growth in the early stage and only particle growth in the later stage were proposed by Slistan-Grijalva et al.
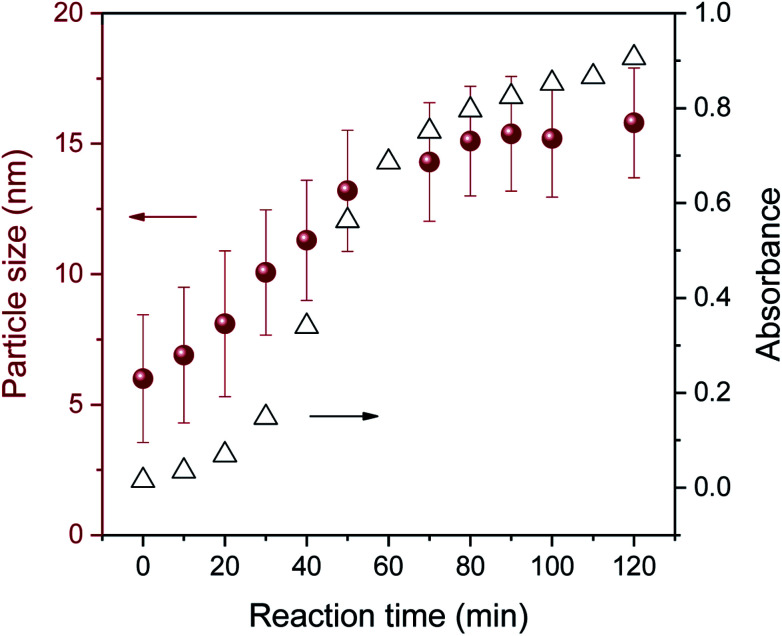
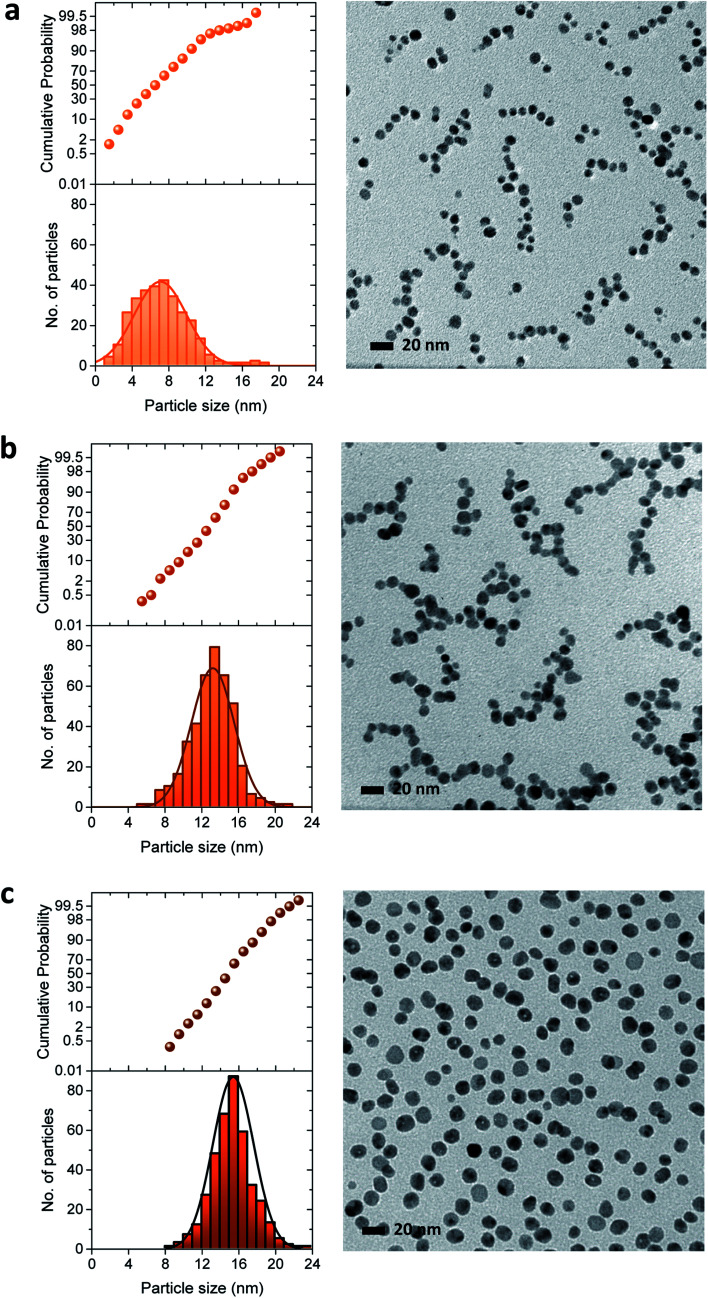
The three-stage particle formation identified in the UV-vis spectra was further examined by measuring particle size as a function of a reaction time, as seen in Fig. 5. The selected particle size histograms and TEM micrographs that represent each stage are presented in Fig. 6. Particle size increased during the initial period of 0–30 min, indicating the coexistence of nucleation and particle growth in Stage I. As will be discussed in greater detail later, Fig. 3a shows that Stage I was greatly shortened as the concentration of ethylene glycol increased. This major positive effect of the additional reducing sites on the facilitation of nucleation and particle growth suggests that particle growth in Stage I was dominated by the reduction of silver ions adsorbed on the particle surface. The size histogram and TEM micrograph of the particles formed at 10 min show a relatively wide range of particle size (Fig. 6a). Instability in the early reaction stage associated with accelerated nucleation was likely to contribute to the broader size distribution.
Fig. 5. Average size of pure silver nanoparticles synthesized in a 5% EG/2% PEG 100 binary polyol solution as a function of reaction time.
Fig. 6. Particle size histograms and TEM micrographs of silver nanoparticles produced in a 5% EG binary polyol solution at (a) 10, (b) 50, and (c) 100 min. The distribution of particle size was estimated by a normal distribution.
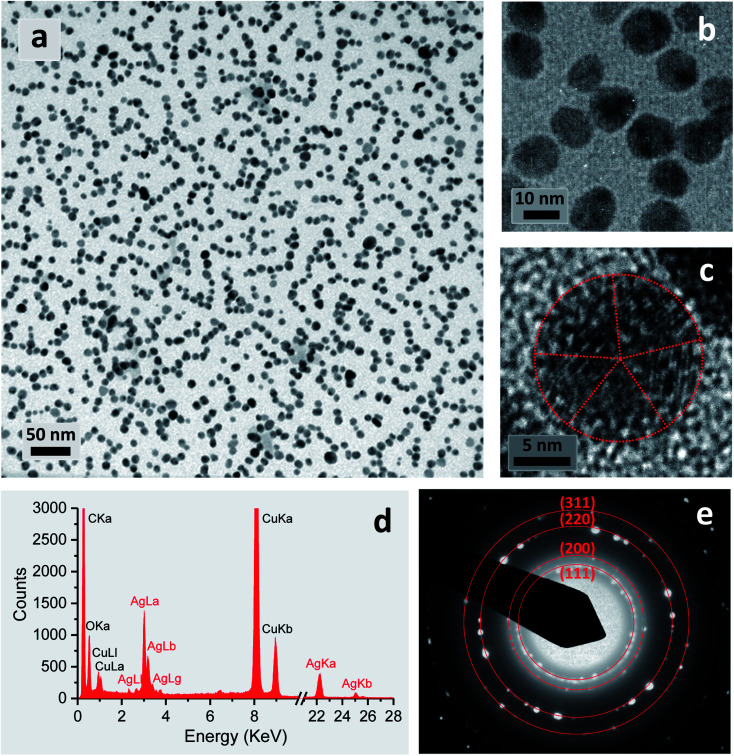
In Stage II (30–70 min), particle size increased rapidly to 14.3 nm. The coalescence of small particles, which expedites particle growth, was considered a predominant growth pathway in this stage. As will be shown later (Fig. 7c), multiple crystal domains observed in a particle support the coalescent process. Very small particles present in Stage I became less observable. It was interesting to observe that several particles assembled into small chains. This linkage probably results from the coordinate complexes of EG and/or PEG 100 with silver ions adsorbed on the surface of particles.
Fig. 7. Characterization of the final product of silver nanoparticles obtained by the 5% EG/2% PEG 100 binary polyol process at 80 °C for 120 min. (a)–(c) TEM micrographs at various magnifications. The boundaries of a penta-twinned silver nanoparticle were indicated using a red dot line. (d) EDS spectrum. (e) SAED pattern, revealing characteristic lattice spacings of metallic silver, which were indicated using a red solid line.
As Stage III (70–120 min) was entered, the growth rate of particles was substantially subdued, yielding a slope change. This reduced growing rate indicates that the Ostwald ripening process,13 by which the dissolution of smaller particles followed by deposition on the larger particles, took over as the major growth mechanism. The distribution of particle size in Stage III (Fig. 6c) was narrower than in Stages I and II.
Revisiting Fig. 3a shows that the concentration of EG greatly altered the development of the reaction stage. Higher concentrations of EG further shortened the durations of Stages I and II. The excess hydroxyl groups from EG facilitated the nucleation and reduction of silver ions adsorbed onto the particle surface, contributing to the surface reduction growth. The lack of hydroxyl groups for the control, PEG 0.4 (2–20%), and 0.3% EG resulted in confining only Stage I throughout the entire reaction studied. The comparison of the optical response behavior across various EG concentrations indicates that the blend of EG of more than 5% (about 4 mole hydroxyl/ether oxygen) became less effective in promoting particle formation. In particular, little changes in absorption during Stage III above 5% EG indicate that particle growth in Stage III did not rely on the surface reduction as much as it did in Stage II. This supports the notion that the particle growth observed in Stage III proceeded mainly through Ostwald ripening rather than through the surface reduction.
3.3. Stability of silver nanoparticles
The reaction in a 5% EG/2% PEG 100 binary polyol solution at 80 °C for 120 min yielded 32 ± 6% conversion into silver nanoparticles. Fig. 7(a)–(c) show the TEM micrographs of the corresponding final product at various magnifications. Uniformly dispersed silver nanoparticles that were 15.8 ± 2.2 nm in diameter were produced in an aqueous solution. Careful observation of a particle shows that it formed a decahedral structure, wherein the twinned crystals display five-twin boundaries (Fig. 7c). The EDS spectrum of the nanoparticles shows silver signals (Fig. 7d). The Cu signals were originated from the TEM copper grid. The corresponding SAED pattern displayed in Fig. 7(e) shows concentric rings with intermediate bright dots, which were attributed to the diffraction from the (1 1 1), (2 0 0), (2 2 0), and (3 1 1) planes of the face-centered cubic (fcc) structure of elemental silver according to the database of Joint Committee on Powder Diffraction Standards (JCPDS) file no. 04-0783. These results confirmed the formation of elemental silver nanoparticles.
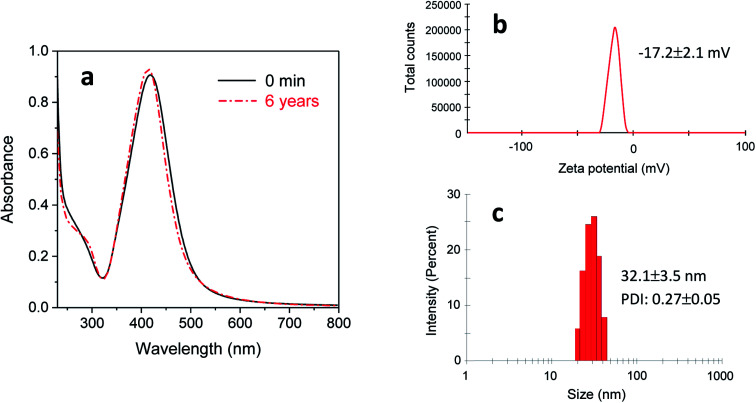
The stability of purified silver nanoparticles (dispersed in DI water) was examined by recollecting a UV-vis spectrum after 6 years of storage at room temperature. Fig. 8(a) shows that a 6 year-old colloidal solution exhibited almost the same optical response as the colloidal solution immediately following the reaction (denoted as 0 min of storage), indicating its remarkable stability. Consistently, the Zeta potential of this colloidal solution was −17.2 ± 2.1 mV (Fig. 8b). This relatively high negative Zeta potential suggests that PEG 100 and/or EG bound onto the surface of nanoparticles, leading to interparticle repulsion. The inhibited particle aggregation was also supported by the measurement of particle size distribution. Fig. 8(c) shows that the average particle size (32.1 ± 3.5 nm) after 6 years of storage obtained by the dynamic light scattering did not differ greatly from the earlier measurement (15.8 ± 2.2 nm) by TEM. Therefore, the EG/PEG 100 binary polyol process is considered to be an appropriate method for producing silver nanoparticles with enhanced colloidal stability.
Fig. 8. Stability of silver nanoparticles prepared by synthesizing in a 5% EG/2% PEG 100 aqueous solution at 80 °C for 120 min and re-dispersing them in DI water: (a) UV-vis spectrum, (b) Zeta potential, and (c) size distribution after 6 years of storage at room temperature.
3.4. Minimum inhibitory concentration
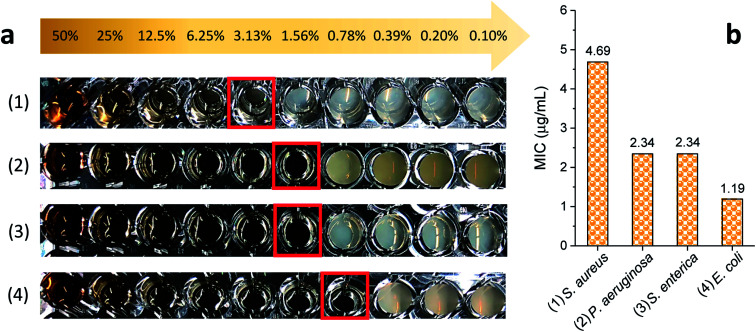
The MICs of silver nanoparticles, which were produced by the 5% EG/2% PEG 100 binary polyol process, for four representative human and foodborne pathogenic bacteria were measured. The results of the MIC test are presented in Fig. 9. The photographs of the serially diluted testing solutions show that the inhibition of bacterial growth, which was indicated by no turbidity, was observed until the fifth, sixth, and seventh well from the left (that is the highest concentration, 75 μg mL−1), respectively, for S. aureus, P. aeruginosa, S. enterica, and E. coli. Their MICs were 4.7, 2.3, 2.3, and 1.2 μg mL−1 (27.7, 13.5, 13.5, and 7.1 μM), respectively, in all three replicates. These MICs were smaller than the values reported in the literature.35–38 The reduced MICs were attributed to the smaller size of the nanoparticles that were uniformly produced in the binary polyol system. The size dependence of antibacterial effectiveness was also observed in other studies.26,38 Silver nanoparticles with 4–6 nm in diameter, which were synthesized using a combination of the sputter deposition technique and PVP-glycerol, displayed complete growth inhibition of E. coli and S. epidermidis, which generally occurs on the skin and mucous membranes of humans.30,31 The enhanced biocidal activity of smaller particles seems reasonable because they not only produce a higher concentration of silver ions due to the increased surface-area-to-volume ratio, but also readily reach bacteria proximity. The dissolution rate of silver for 5–10 nm particles was much greater than that for 50 nm particles in natural waters.17 According to examination by high-angle annular dark-field scanning TEM, a direct interaction with Gram-negative bacteria was predominant for silver nanoparticles that were less than 10 nm in size as compared with larger particles.26
Fig. 9. (a) Photographs of the antibacterial activities of purified silver nanoparticles with a series of decrement concentration (50–0.0977%) against (a) S. aureus, (b) P. aeruginosa, (c) S. enterica and (d) E. coli. The turbidity of solutions indicates the growth of microorganisms, and a red square indicates the lowest concentration where there is no turbidity. (b) Comparison of the MICs of silver nanoparticles for four Gram-positive and Gram-negative bacteria.
The MIC for Gram-positive S. aureus was approximately twice as large as those for Gram-negative P. aeruginosa, S. enterica, and E. coli, showing that the antibacterial activity of silver nanoparticles depends at least in part on the type of bacteria that are exposed to it. The comparison of bactericidal activity between dispersed and grafted silver nanoparticles revealed that Gram-positive bacteria with peptidoglycan rigid cellular walls were more resistant to the penetration of nanoparticles into the cytoplasm than Gram-negative bacteria were.39 The relatively thinner cell walls of Gram-negative bacteria allowed two mechanisms to occur—interaction with silver ions and nanomechanical attacks—and thus lowered their MICs. The synergy of these two biocidal actions of silver nanoparticles is also responsible for their MICs' being smaller than those of silver ions.40,41 For example, the MICs of silver nanoparticles (39–78.5 nm) for E. coli and S. aureus were 7.8 and 31.2 μg mL−1, respectively, whereas those of silver ions (AgNO3) were 15.6 and 62.5 μg mL−1, respectively.41 Among the Gram-negative bacteria studied in this study, the MIC of E. coli was the smallest, showing the highest degree of potential for cleaning and disinfecting food-related environments.
4. Conclusions
Although a complete accounting of the mechanism underlying the antibacterial activity of silver nanoparticles remains to be achieved, the ensuing research has supported its strong dependence on particle size and size distribution. Reducing the size of nanoparticles in a controlled manner is the key to increasing the effectiveness of their biocidal performance against harmful bacteria. The polyol process, which uses poly-alcohols as both solvents and reducing agents, is not efficient in the formation of nanoparticles, thus requiring protective agents and high temperatures. In this study, an easy, low-cost, and controllable water-based synthetic method of generating silver nanoparticles was developed by modifying the polyol process. The reduction reaction of ethylene glycol was successfully activated in an aqueous environment at a mild temperature (80 °C) with the aid of a high-molecular-weight polyethylene glycol (100 000 g mol−1), which chelated silver ions via its coiled conformation. This binary polyol process effectively produced 15.8 ± 2.2 nm silver nanoparticles (a ninefold increase in optical density as compared with that for PEG 100 alone) with good colloidal stability in aqueous media. Replacing EG with the low-molecular-weight PEGs (PEG 0.4 and PEG 2) was not efficient in enhancing the reduction reaction or particle formation. Step changes on the UV-vis absorption of silver colloidal solutions and the corresponding λmax as well as their absorption dependence on the concentration of ethylene glycol suggested three-stage particle formation: (1) nucleation and particle growth through surface reduction, (2) particle growth through coalescence, and (3) particle growth through Ostwald ripening. The MICs of the purified final product against S. aureus, P. aeruginosa, S. enterica, and E. coli were 4.7, 2.3, 2.3, and 1.2 μg mL−1, respectively. Such small MIC values were attributed to the small size of the silver nanoparticles, which magnified their multiple antibacterial functions. Reducing MICs by controlling particle size in aqueous binary polyol solutions makes silver nanoparticles suitable as a targeted disinfecting tool in healthcare and food packaging applications.
Conflicts of interest
There are no conflicts of interest to declare.
Supplementary Material
Acknowledgments
This research received no specific grant from any funding agency in the public, commercial, or not-for-profit sectors. USDA is an equal opportunity provider and employer.
References
- Fiévet F. Lagier J. P. Figlarz M. MRS Bull. 1989;14:29–34. doi: 10.1557/S0883769400060930. [DOI] [Google Scholar]
- Fievet F. Lagier J. P. Blin B. Beaudoin B. Figlarz M. Solid State Ionics. 1989;32–33:198–205. doi: 10.1016/0167-2738(89)90222-1. [DOI] [Google Scholar]
- Sun Y. Xia Y. Science. 2002;298:2176–2179. doi: 10.1126/science.1077229. [DOI] [PubMed] [Google Scholar]
- Kurihara L. K. Chow G. M. Schoen P. E. Nanostruct. Mater. 1995;5:607–613. doi: 10.1016/0965-9773(95)00275-J. [DOI] [Google Scholar]
- Varanda L. C. Jafelicci Jr M. J. Am. Chem. Soc. 2006;128:11062–11066. doi: 10.1021/ja060711i. [DOI] [PubMed] [Google Scholar]
- Liu C. Wu X. Klemmer T. Shukla N. Yang X. Weller D. Roy A. G. Tanase M. Laughlin D. J. Phys. Chem. B. 2004;108:6121–6123. doi: 10.1021/jp0312971. [DOI] [PubMed] [Google Scholar]
- Harpeness R. Gedanken A. Langmuir. 2004;20:3431–3434. doi: 10.1021/la035978z. [DOI] [PubMed] [Google Scholar]
- Gorka D. E. Osterberg J. S. Gwin C. A. Colman B. P. Meyer J. N. Bernhardt E. S. Gunsch C. K. DiGulio R. T. Liu J. Environ. Sci. Technol. 2015;49:10093–10098. doi: 10.1021/acs.est.5b01711. [DOI] [PubMed] [Google Scholar]
- Luo C. Zhang Y. Zeng X. Zeng Y. Wang Y. J. Colloid Interface Sci. 2005;288:444–448. doi: 10.1016/j.jcis.2005.03.005. [DOI] [PubMed] [Google Scholar]
- Popa M. Pradell T. Crespo D. Calderon-Moreno J. M. Colloids Surf., A. 2007;303:184–190. doi: 10.1016/j.colsurfa.2007.03.050. [DOI] [Google Scholar]
- Hatakeyama Y. Morita T. Takahashi S. Onishi K. Nishikawa K. J. Phys. Chem. C. 2011;115:3279–3285. [Google Scholar]
- Slepička P. Elashnikov R. Ulbrich P. Staszek M. Kolská Z. Švorčík V. J. Nanopart. Res. 2015;17:11. doi: 10.1007/s11051-014-2850-z. [DOI] [Google Scholar]
- Silvert P. Y. Herrera-Urbina R. Tekaia-Elhsissen K. J. Mater. Chem. 1997;7:293–299. doi: 10.1039/A605347E. [DOI] [Google Scholar]
- Slistan-Grijalva A. Herrera-Urbina R. Rivas-Silva J. F. Avalos-Borja M. Castillon-Barraza F. F. Posada-Amarillas A. Phys. E. 2005;25:438–448. doi: 10.1016/j.physe.2004.07.010. [DOI] [Google Scholar]
- Couto G. G. Klein J. J. Schreiner W. H. Mosca D. H. de Oliveira A. J. A. Zarbin A. J. G. J. Colloid Interface Sci. 2007;311:461–468. doi: 10.1016/j.jcis.2007.03.045. [DOI] [PubMed] [Google Scholar]
- Nam S. Parikh D. V. Condon B. Zhao Q. Yoshioka-Tarver M. J. Nanopart. Res. 2011;13:3755–3764. doi: 10.1007/s11051-011-0297-z. [DOI] [Google Scholar]
- Dobias J. Bernier-Latmani R. Environ. Sci. Technol. 2013;47:4140–4146. doi: 10.1021/es304023p. [DOI] [PubMed] [Google Scholar]
- Liu J. Y. Hurt R. H. Environ. Sci. Technol. 2010;44:2169–2175. doi: 10.1021/es9035557. [DOI] [PubMed] [Google Scholar]
- Lok C. N. Ho C. M. Chen R. He Q. Y. Yu W. Y. Sun H. Tam P. K. Chiu J. F. Che C. M. J. Biol. Inorg Chem. 2007;12:527–534. doi: 10.1007/s00775-007-0208-z. [DOI] [PubMed] [Google Scholar]
- Gupta A. Maynes M. Silver S. Appl. Environ. Microbiol. 1998;64:5042–5045. doi: 10.1128/aem.64.12.5042-5045.1998. [DOI] [PMC free article] [PubMed] [Google Scholar]
- Matsumura Y. Yoshikata K. Kunisaki S. Tsuchido T. Appl. Environ. Microbiol. 2003;69:4278–4281. doi: 10.1128/AEM.69.7.4278-4281.2003. [DOI] [PMC free article] [PubMed] [Google Scholar]
- Klueh U. Wagner V. Kelly S. Johnson A. Bryers J. D. J. Biomed. Mater. Res., Part A. 2000;53:621–631. doi: 10.1002/1097-4636(2000)53:6<621::AID-JBM2>3.0.CO;2-Q. [DOI] [PubMed] [Google Scholar]
- Chamakura K. Perez-Ballestero R. Luo Z. Bashir S. Liu J. Colloids Surf., B. 2011;84:88–96. doi: 10.1016/j.colsurfb.2010.12.020. [DOI] [PubMed] [Google Scholar]
- Dror-Ehre A. Mamane H. Belenkova T. Markovich G. Adin A. J. Colloid Interface Sci. 2009;339:521–526. doi: 10.1016/j.jcis.2009.07.052. [DOI] [PubMed] [Google Scholar]
- El Badawy A. M. Silva R. G. Morris B. Scheckel K. G. Suidan M. T. Tolaymat T. M. Environ. Sci. Technol. 2011;45:283–287. doi: 10.1021/es1034188. [DOI] [PubMed] [Google Scholar]
- Morones J. R. Elechiguerra J. L. Camacho A. Holt K. Kouri J. B. Ramirez J. T. Yacaman M. J. Nanotechnology. 2005;16:2346–2353. doi: 10.1088/0957-4484/16/10/059. [DOI] [PubMed] [Google Scholar]
- Li W. R. Xie X. B. Shi Q. S. Zeng H. Y. OU-Yang Y. S. Chen Y. B. Appl. Microbiol. Biotechnol. 2010;85:1115–1122. doi: 10.1007/s00253-009-2159-5. [DOI] [PubMed] [Google Scholar]
- Elechiguerra J. L. Burt J. L. Morones J. R. Camacho-Bragado A. Gao X. Lara H. H. Yacaman M. J. J. Nanobiotechnol. 2005;3:6. doi: 10.1186/1477-3155-3-6. [DOI] [PMC free article] [PubMed] [Google Scholar]
- Carlson C. Hussain S. M. Schrand A. M. Braydich-Stolle L. K. Hess K. L. Jones R. L. Schlager J. J. J. Phys. Chem. B. 2008;112:13608–13619. doi: 10.1021/jp712087m. [DOI] [PubMed] [Google Scholar]
- Siegel J. Kolářová K. Vosmanská V. Rimpelová S. Mater. Lett. 2013;113:59–62. doi: 10.1016/j.matlet.2013.09.047. [DOI] [Google Scholar]
- Siegel J. Staszek M. Polívková M. Řezníčková A. Rimpelová S. Švorčík V. Mater. Today. 2016;3:608–616. doi: 10.1016/j.matpr.2016.01.098. [DOI] [Google Scholar]
- Alshareef A. Laird K. Cross R. B. M. Appl. Surf. Sci. 2017;424:310–315. doi: 10.1016/j.apsusc.2017.03.176. [DOI] [Google Scholar]
- Schneider C. A. Rasband W. S. Eliceiri K. W. Nat. Methods. 2012;9:671–675. doi: 10.1038/nmeth.2089. [DOI] [PMC free article] [PubMed] [Google Scholar]
- Kreibig U. and Vollmer M., Optical Properties of Metal Clusters, Springer verlag, Berlin, Heidelberg, 1995 [Google Scholar]
- Agnihotri S. Mukherji S. Mukherji S. RSC Adv. 2014;4:3974–3983. doi: 10.1039/C3RA44507K. [DOI] [Google Scholar]
- Petrus E. M. Tinakumari S. Chai L. C. Ubong A. Tunung R. Elexson N. Chai L. F. Son R. Int. Food Res. J. 2011;18:55–66. [Google Scholar]
- Kim S. H. Lee H. S. Ryu D. S. Choi S. J. Lee D. S. Korean J. Microbiol. Biotechnol. 2011;39:77–85. [Google Scholar]
- Abalkhil T. A. Alharbi S. A. Salmen S. H. Wainwright M. Biotechnol. Biotechnol. Equip. 2017;31:411–417. doi: 10.1080/13102818.2016.1267594. [DOI] [Google Scholar]
- Taglietti A. Diaz Fernandez Y. A. Amato E. Cucca L. Dacarro G. Grisoli P. Necchi V. Pallavicini P. Pasotti L. Patrini M. Langmuir. 2012;28:8140–8148. doi: 10.1021/la3003838. [DOI] [PubMed] [Google Scholar]
- Lok C. N. Ho C. M. Chen R. He Q. Y. Yu W. Y. Sun H. Tam P. K. Chiu J. F. Che C. M. J. Proteome Res. 2006;5:916–924. doi: 10.1021/pr0504079. [DOI] [PubMed] [Google Scholar]
- Erjaee H. Rajaian H. Nazifi S. Adv. Nat. Sci.: Nanosci. Nanotechnol. 2017;8:025004. doi: 10.1088/2043-6254/aa690b. [DOI] [Google Scholar]


