
Figure 1. OEF remains elevated in the SCA cohort after controlling for hemoglobin.
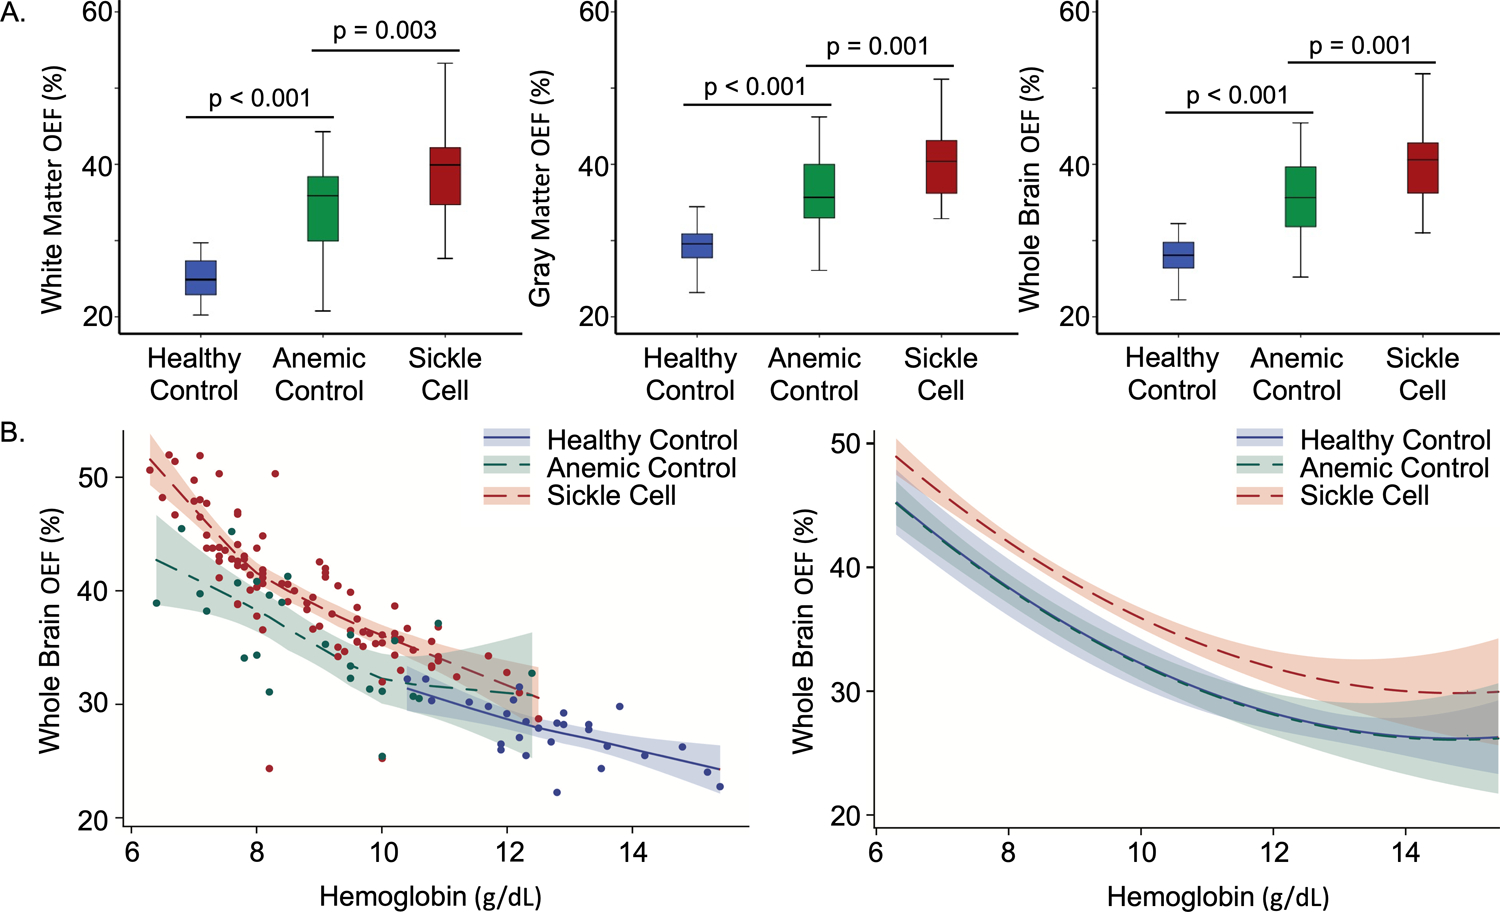
A. OEF is elevated in anemic control participants (green) compared to healthy controls (blue), but significantly lower than participants with SCA (red) in white matter (left), gray matter (middle) and whole brain (right) even though there is not a significant difference in hemoglobin between the AC and SCA cohorts (p = 0.459). B. Whole brain OEF increases as hemoglobin decreases (Spearman’s rho = −0.878, p < 0.001). Data is shown as a LOESS curve fit per cohort on the left. While controlling for age, hemoglobin, hemoglobin-squared and subject-specific effects, whole brain OEF remains significantly elevated in participants with SCA compared to HC (p = 0.001) but there is not a significant elevation in whole brain OEF in the AC participants compared to HC (p = 0.935) on the right. Figure displays hemoglobin effect plot computed at mean age of 12 years.