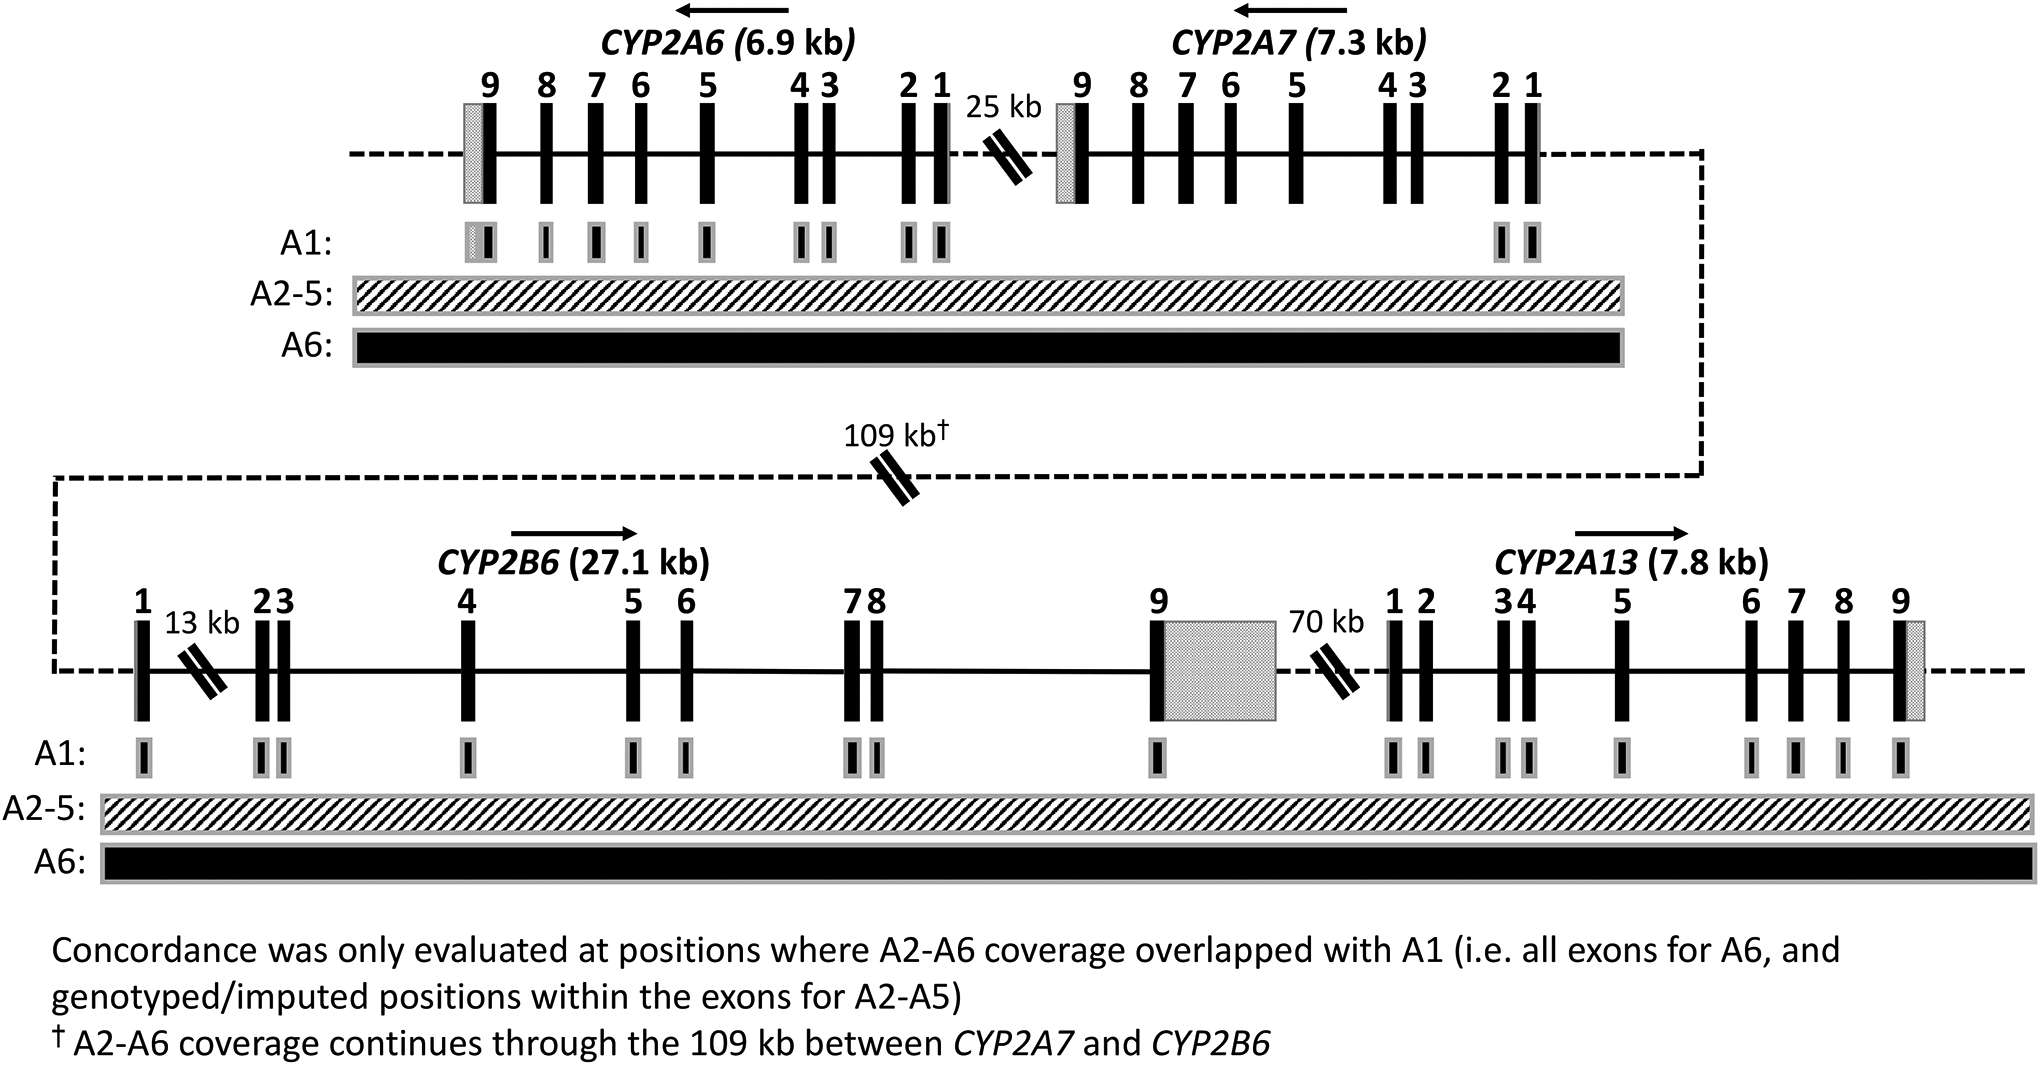
Figure 2. Coverage of approaches A1–6 through CYP2A6, CYP2A7, CYP2B6, and CYP2A13.

The four genes analyzed in this study are indicated by name; arrows above the gene name indicate direction of transcription (genomic position according to GRCh37 is shown increasing from left-to-right). DNA sequence within genes is shown as a solid black line, while intergenic sequence is shown as a dotted line (not to scale). Exons are shown as black rectangles with exon number indicated above, while the 5’- and 3’-UTRs are shown as grey speckled rectangles attached to exons 1 9, respectively. Gene exons, introns (except CYP2B6 intron 1), and UTRs are displayed to scale; double diagonal bars indicate shortened sequence (not to scale). The 109 kb gap between CYP2A7 and CYP2B6 contains the pseudogenes CYP2B7 and CYP2G1P (not shown), while the 70 kb gap between CYP2B6 and CYP2A13 contains CYP2A7P1 and CYP2G2P (not shown). A1 coverage, indicated by black boxes with grey outlines, is limited to the exons in addition to partial coverage of the CYP2A6 3’-UTR (used for genotyping of CYP2A6*1B and rs8192733 in Experiment 2). A2-A5, indicated by a continuous box with a white/grey hatched pattern, covers a limited number of positions for the entire region. A6, indicated by a continuous black box with a grey outline, continuously covers ~300 kb which encompasses the entire region presented.
