
Figure 3. Discordant calls between A6 targeted capture sequencing and A1 amplicon exon sequencing in CYP2A6 are concentrated in specific exons.
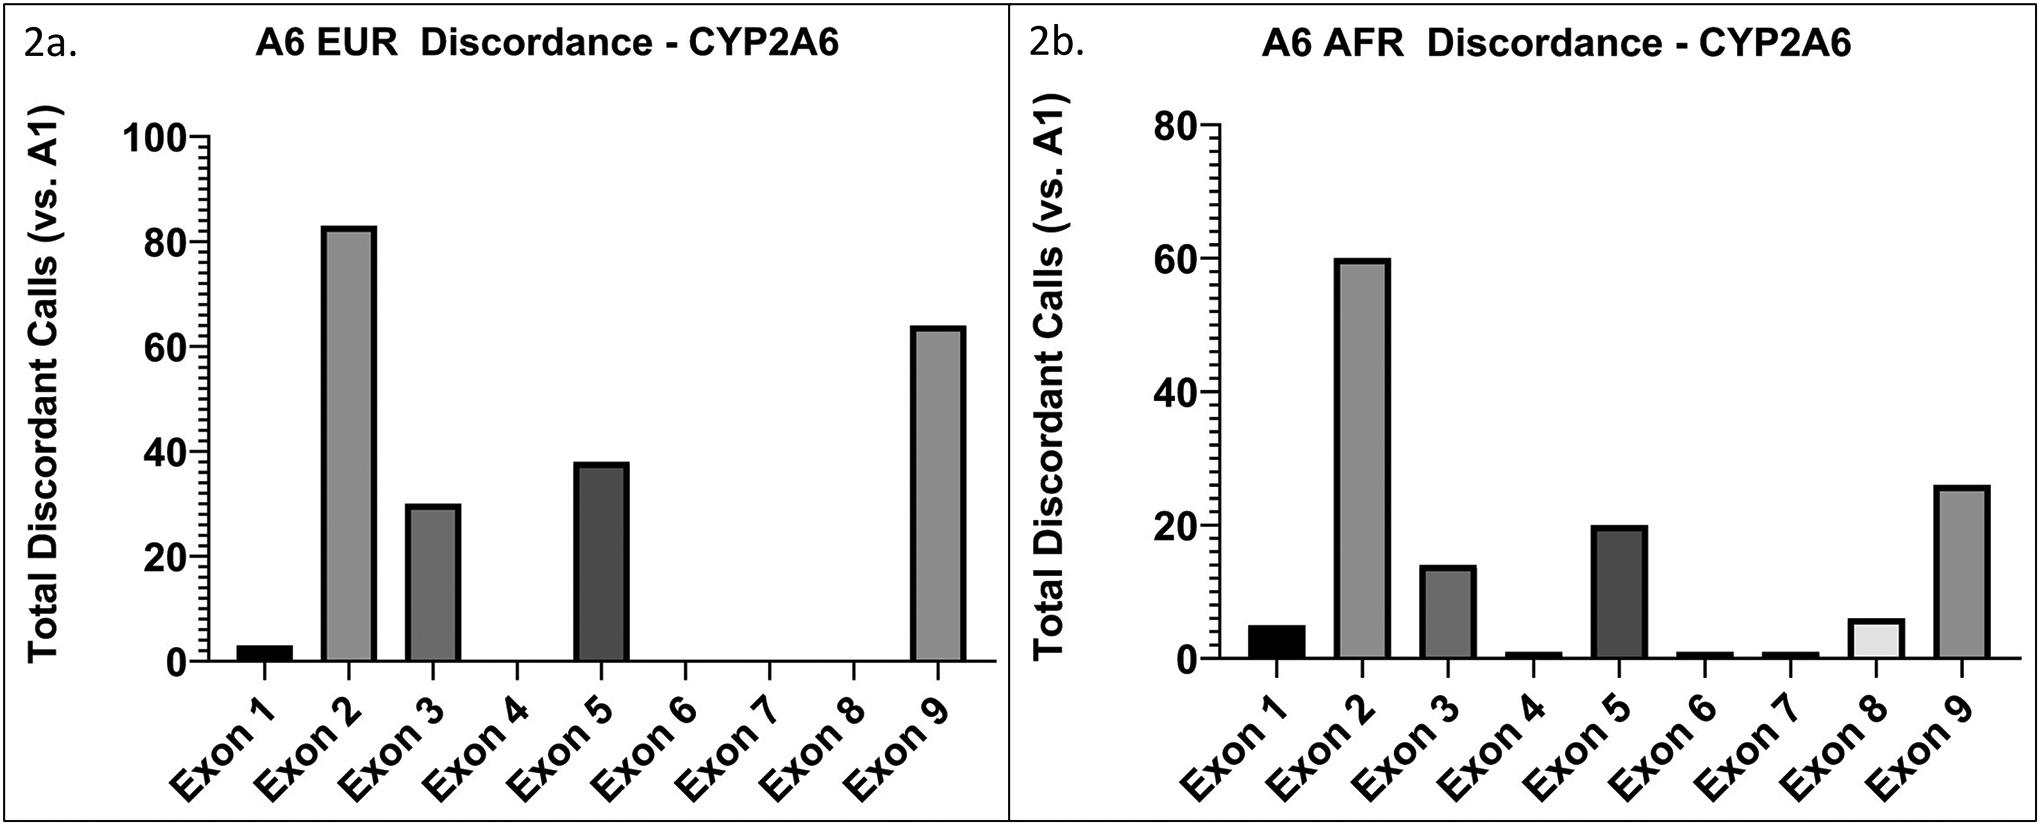
The y-axis represents total discordant calls (i.e. the sum of all discordant calls within each exon across the group) within each exon for a. EUR (n=209), and b. AFR (n=166). Discordant calls in exons 2, 3, 5, and 9 make up ~90% of overall CYP2A6 discordant calls in EUR and AFR.