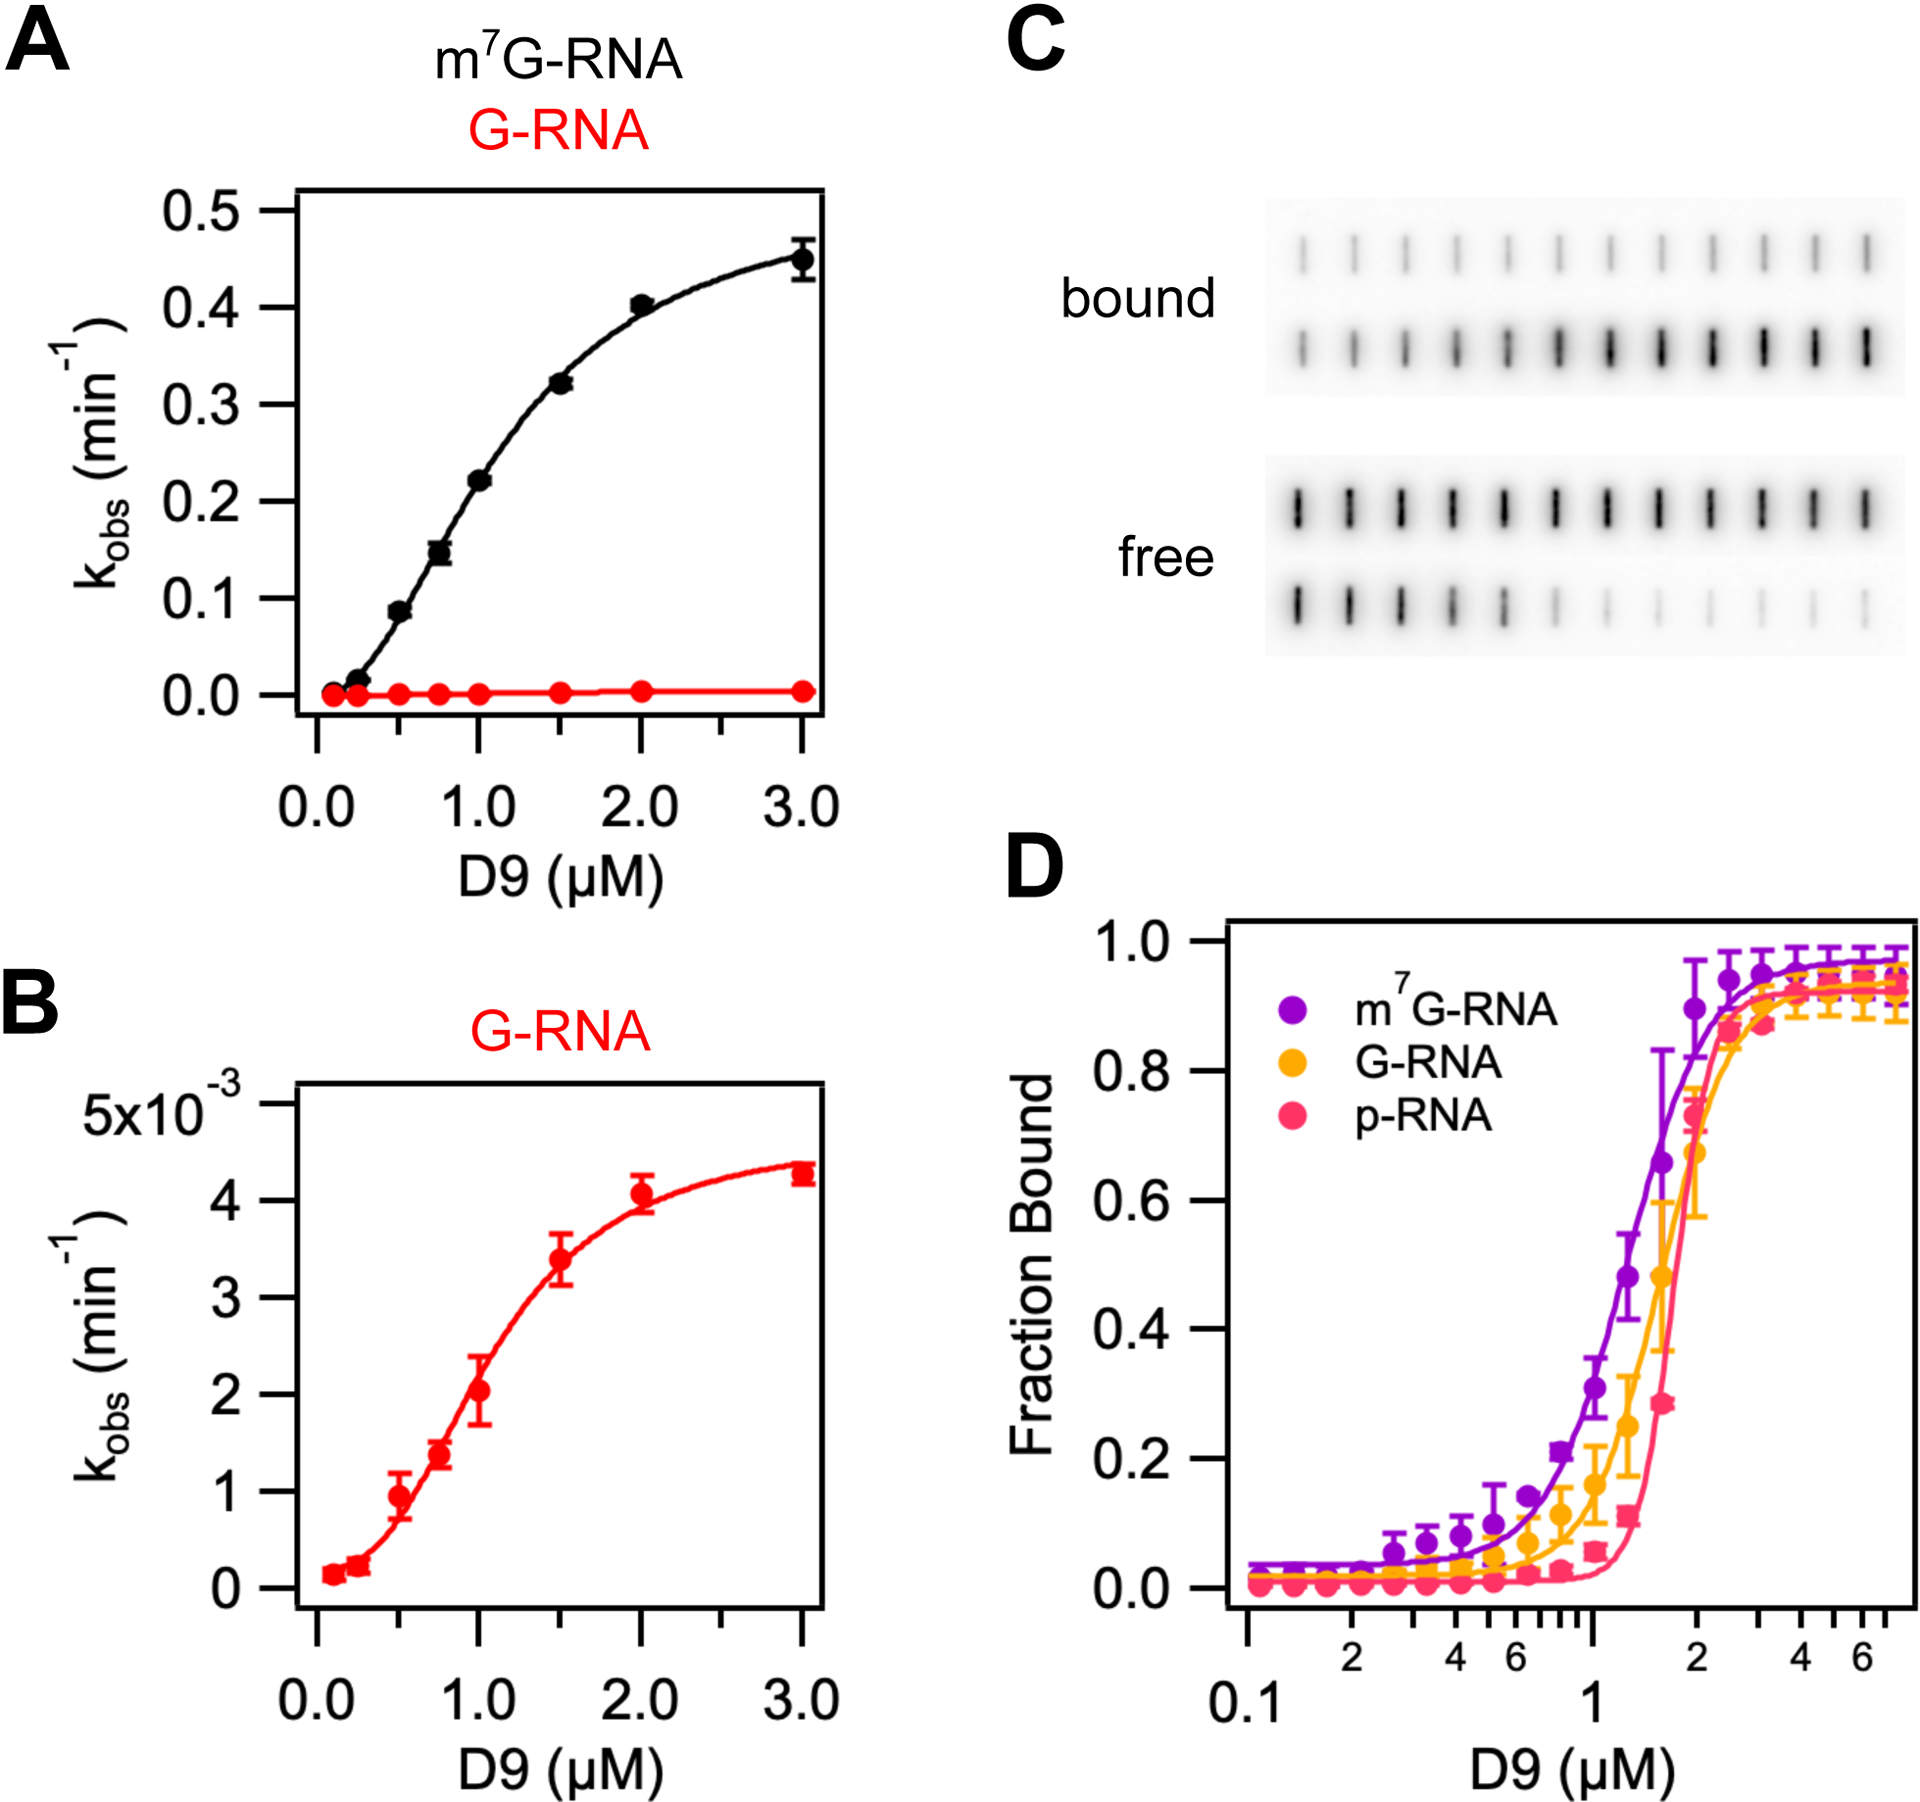
Figure 4.

D9 recognizes methylated mRNA cap during the catalytic step by π-π stacking with conserved aromatic residues. (A) and (B) Graphs of kobs versus wild-type D9 concentration for a 29nt RNA substrate containing a methylated (black) or unmethylated (red) guanine cap. Data were fit to Eq. 1 to determine kmax, Km and Hill coefficient (n), which are listed in Table 2. Error bars are s.e.m. for the rate measured in two independent experiments. (C) Representative filter binding assay results showing raw counts of radiolabeled RNA on nitrocellulose (bound) and Hybond N+ (free) membranes for wild-type D9 and m7G-capped 29nt RNA. (D) Fraction of RNA bound versus concentration of D9 for m7G-capped RNA (purple), G-capped RNA (yellow), and 5’ monophosphate RNA (pink). Data were fit to Eq. 3 to determine the equilibrium dissociation constants and Hill coefficients, which are shown in Table S2. Error is s.e.m. for the binding measured in two independent experiments.
