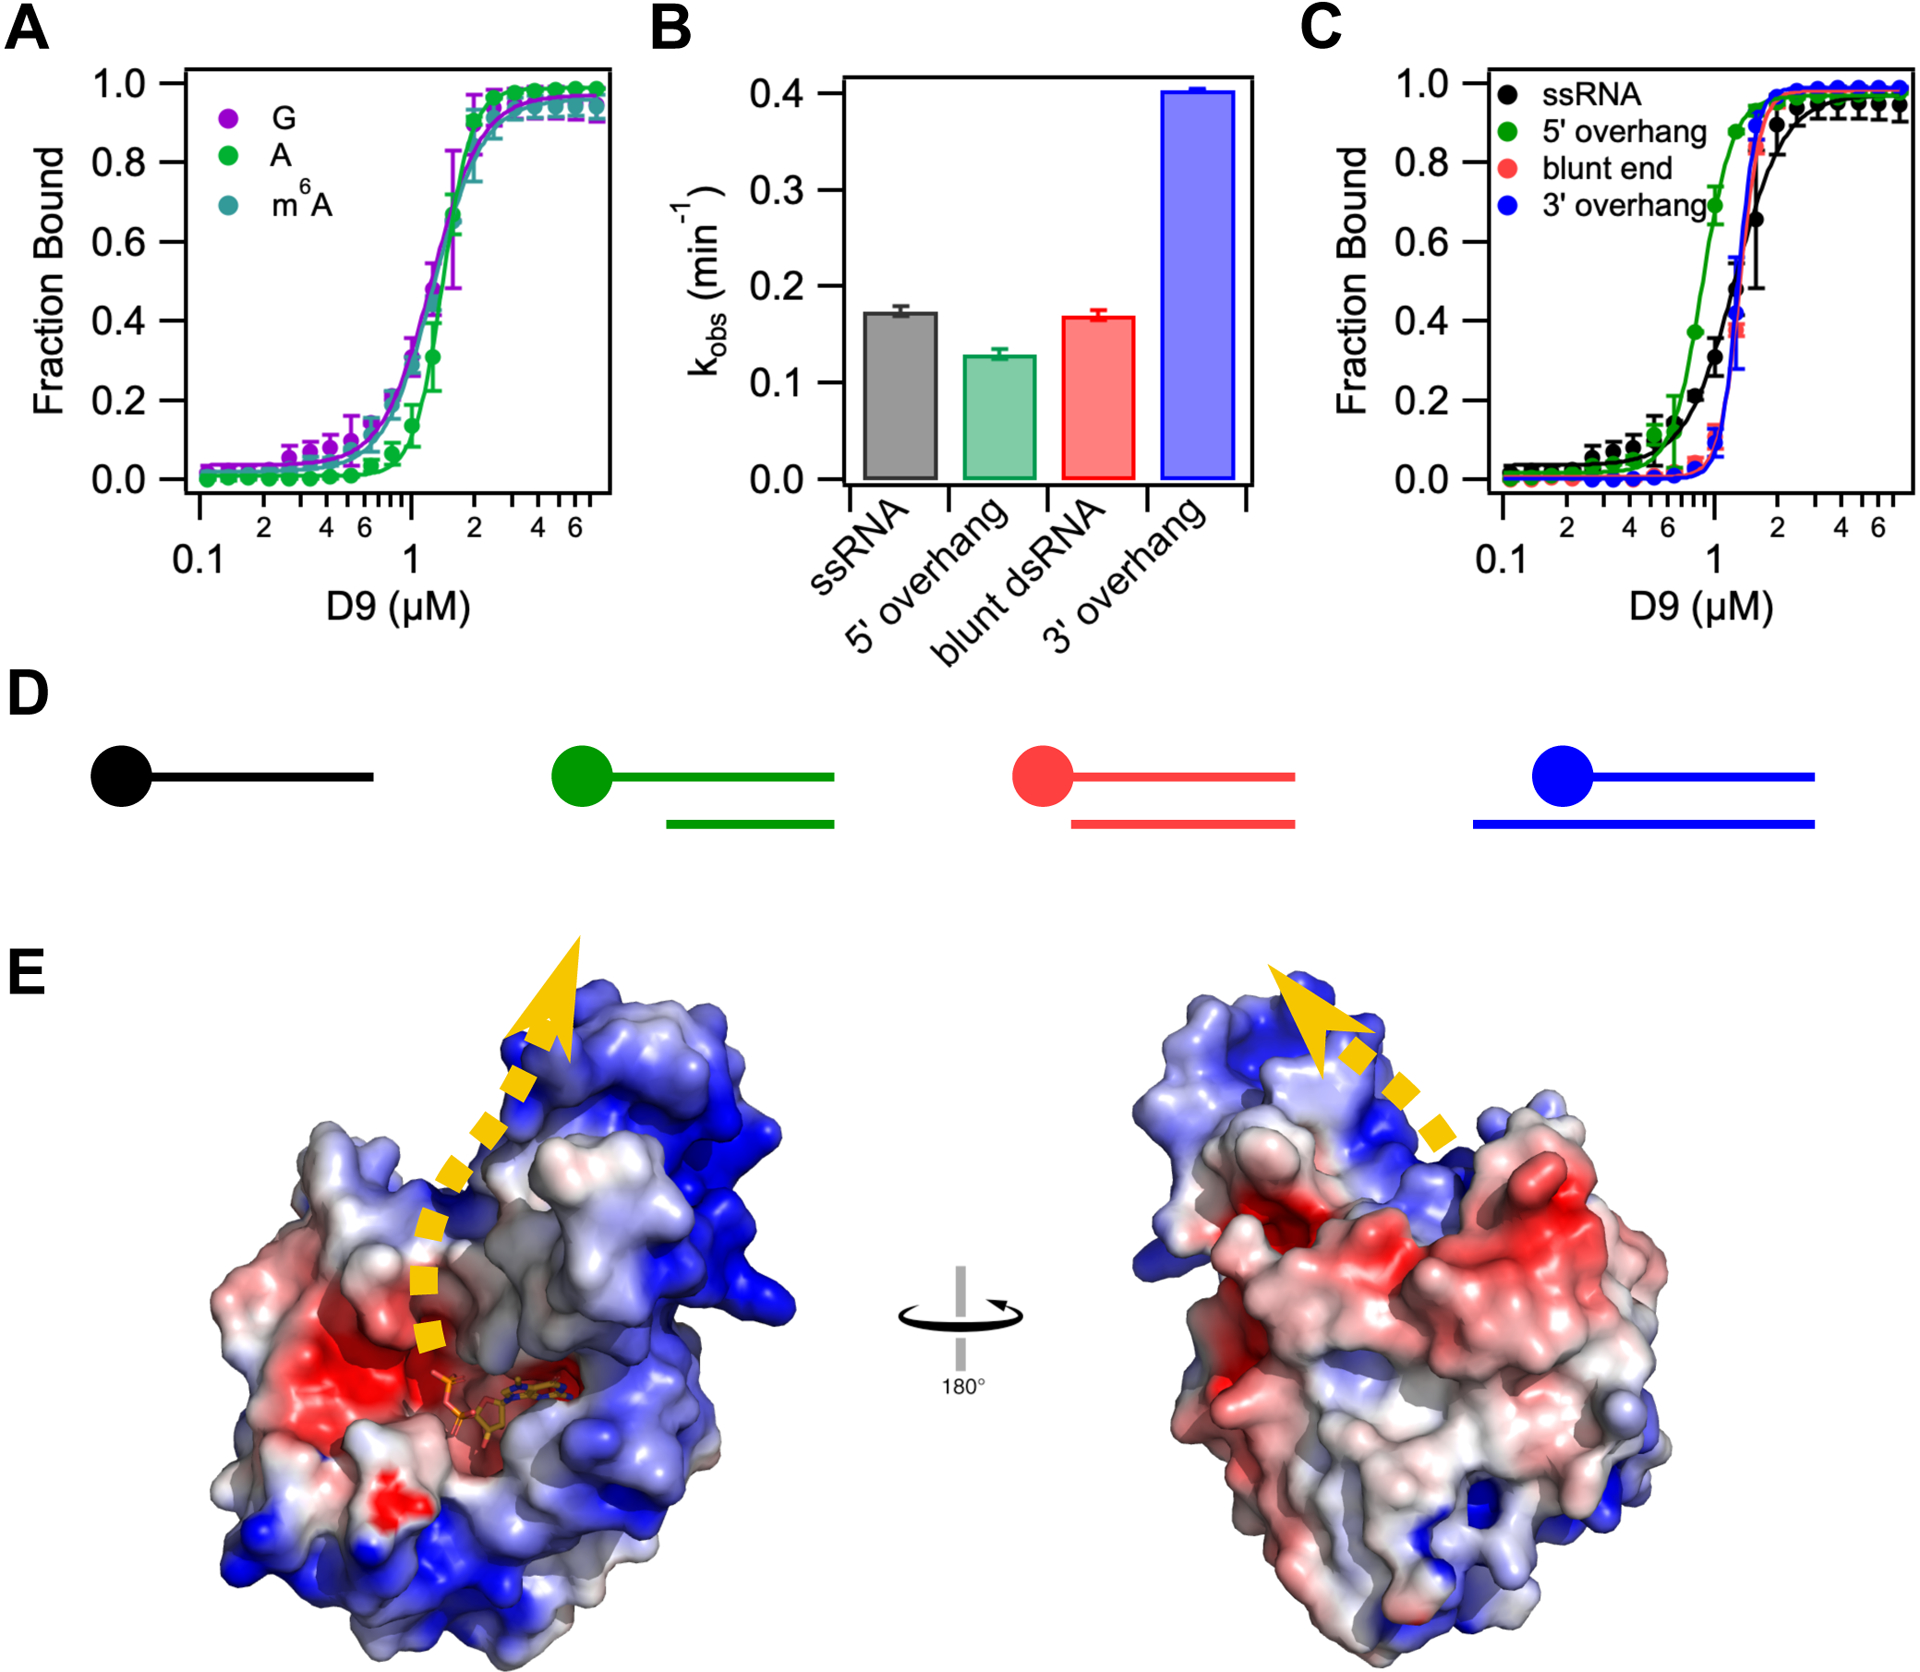
Figure 5.

D9 does not show selectivity for first transcribed nucleotide identity or cap accessibility. (A) Fraction of RNA bound versus concentration of D9 for RNAs containing a guanosine (purple), adenosine (green) or N6-methyl adenosine (teal) at the first transcribed nucleotide position. (B) Bar graph showing the decapping rates of single stranded and double-stranded RNA constructs. All constructs contain the same m7G-capped 29nt RNA. Double stranded RNA constructs are annealed to complementary RNA of variable length to engineer a range of cap accessibility from fully accessible (10nt 5’ overhang) to “inaccessible” (10nt 3’ overhang). (C) Fraction of RNA bound versus concentration of D9 for the same RNA constructs used in (B). The equilibrium dissociation constants and Hill coefficients for all equilibrium binding assays are shown in Table S2. (D) Schematic representation of dsRNA constructs used in (B) and (C) from most accessible (left) to least accessible m7G cap (right). The m7G cap is shown as a circle on the top strand. Anti-sense RNA sequences are listed in Table S2. (E) Electrostatic surface potential of product-bound D9 (−5 to +5 kT/e). Error bars show the s.e.m for the binding or rate measured in two independent experiments. Dashed yellow line represents the predicted RNA path based on the orientation of the cap and location of positively charged patches on the protein surface.
