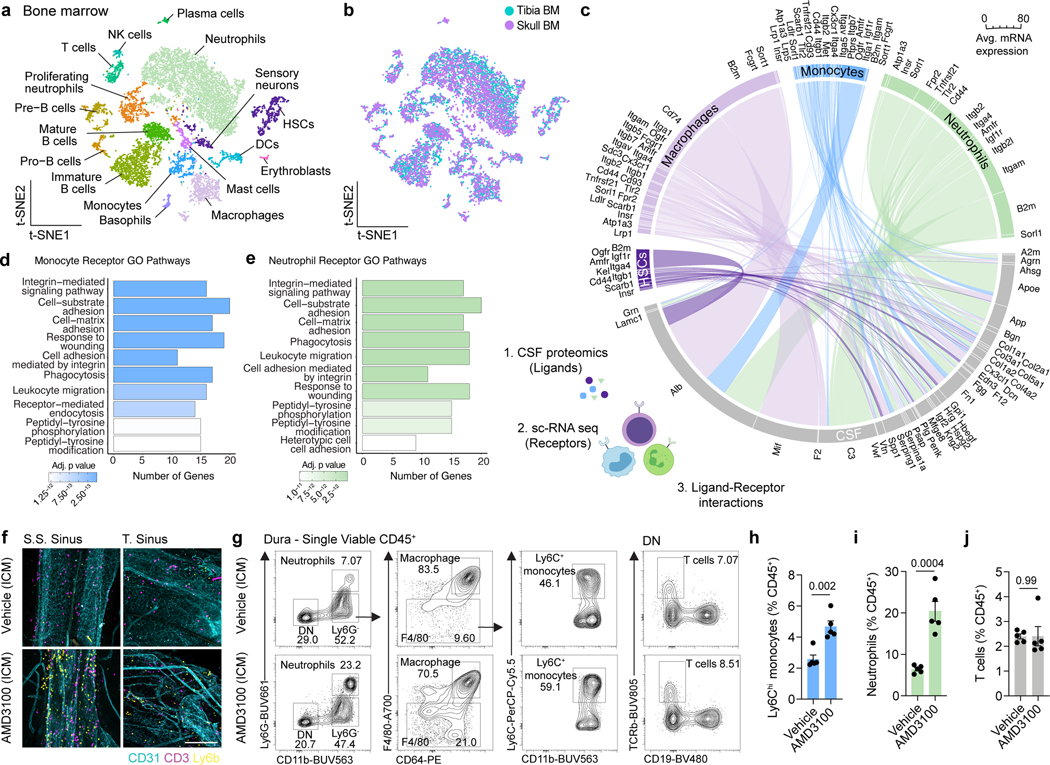
Fig. 2. Functional interactions between CSF and the skull bone marrow niche.
a, b, t-distributed stochastic neighbor embedding (tSNE) visualizations of single-cell RNAseq from dorsal skull and tibial bone marrow from 2 month old mice colored by cell type a, or sample b. c, Chord plot detailing between CSF ligands identified by unlabeled liquid chromatography-mass spectrometry (LC-MS) and receptors on skull bone marrow hematopoietic stem cells (HSCs), macrophages, monocytes, and neutrophils identified by sc-RNA-seq. d, e, Gene ontology pathway analysis on receptor genes with at least one CSF ligand in monocytes and neutrophils. f, Representative immunohistochemistry of CD3+ and Ly6b+ cells at the superior sagittal sinus (S.S. Sinus) and transverse sinus (T. Sinus) of the dura mater, 24 hours after an intra-cisterna magna (i.c.m.) injection of 10 μg AMD3100 or artificial cerebrospinal fluid (aCSF). Scale bar: 200 μm. g-j, Flow cytometry gating strategy and frequency of Ly6Chi monocytes, neutrophils, and T cells proportions following an i.c.m. injection of 10 μg AMD3100 or aCSF. n = 5 mice per group. Data are means ± SEM, p values represent a two-sided Student’s t-test.

