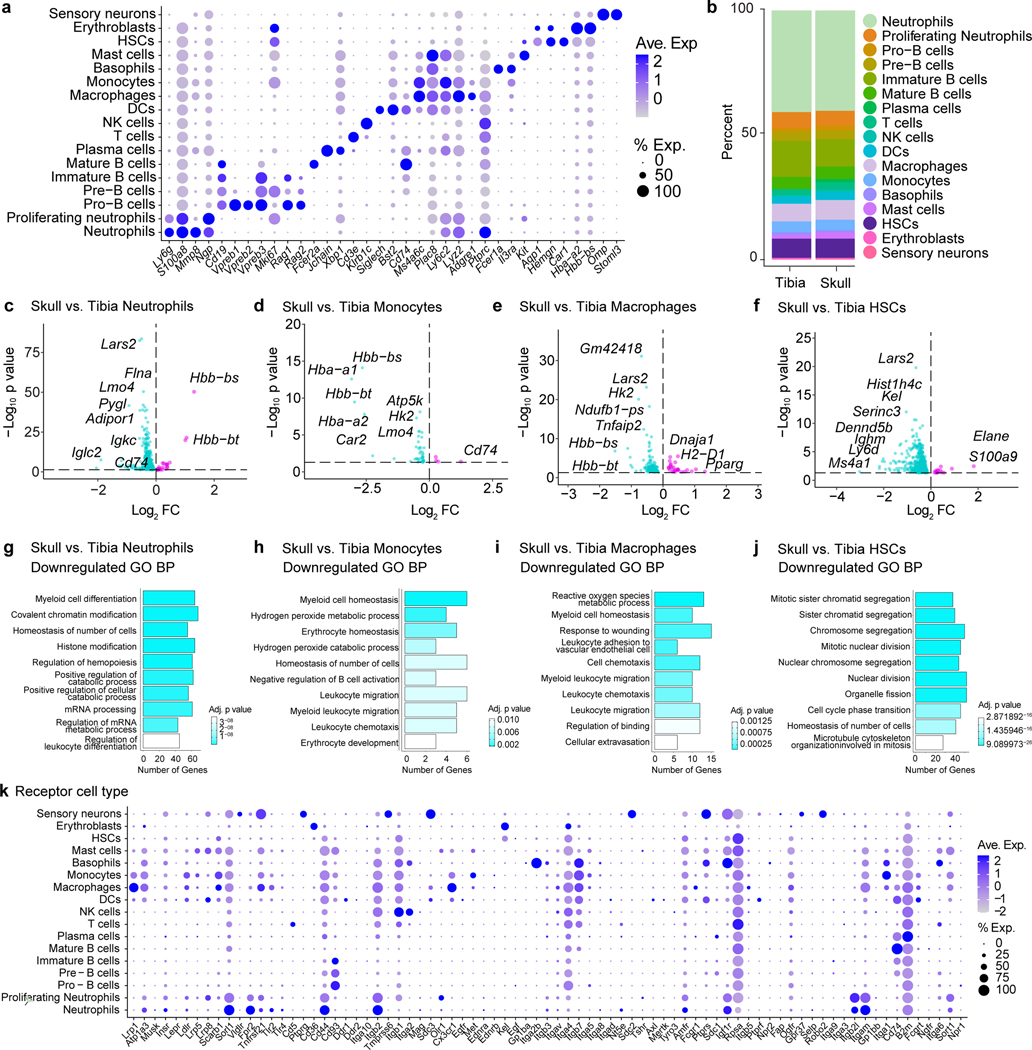
Extended Data Fig. 2. Characterization of differences between the skull and tibial marrow populations.
a, Dot plot demonstrating scaled gene expression and percentage of cells expressing genes for cluster phenotyping markers for bone marrow cell types from scRNA-seq analysis. b, Analysis of cluster proportions in skull and tibial bone marrow. c-f, Volcano plots of differentially expressed genes in neutrophils, monocytes, macrophages, and HSCs. Magenta dots represent upregulated transcripts, while cyan dots represent downregulated transcripts in skull populations compared to the tibia. y-axes represent adjusted log2 p value for cluster changes between skull and tibia. Dotted line represents an adjusted p value of 0.05 (general linear mixed model with Benjamini-Hochberg correction). g-j, Top 10 downregulated gene ontology pathways in skull vs. tibia for differentially expressed genes in neutrophils, monocytes, macrophages, and HSCs. k, Dot plot of receptor expression in skull bone marrow cells, scaled by gene expression and percentage of cells expressing the gene, showing expression of receptors for which there is a cognate CSF ligand.

