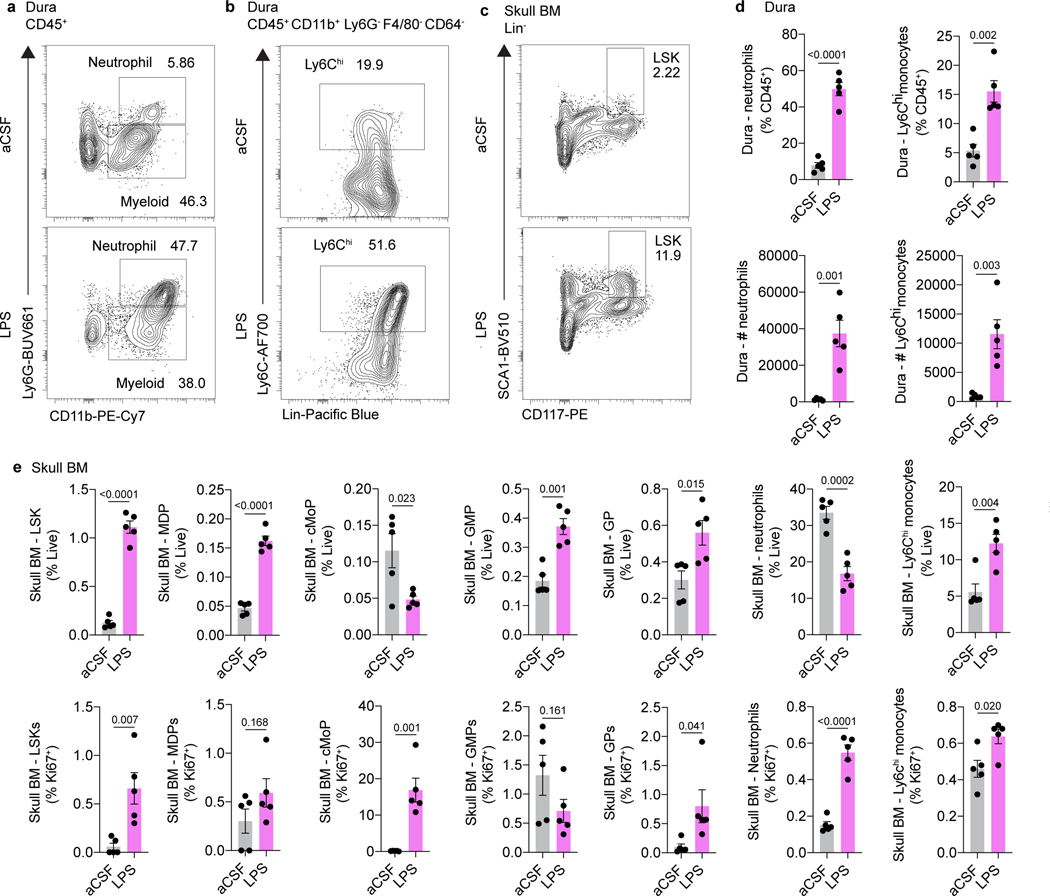
Extended Data Fig. 6. Intracisternal injection of LPS enhances hematopoiesis in skull bone marrow and triggers myeloid egress to the dura.
a, LPS (1.25 μg, 4 μL) was injected into the skull bone marrow. After 24 hours, skullcaps and dura were processed for flow cytometry. Representative flow plots of neutrophils in the dura in aCSF and LPS-treated mice. b, Representative flow plots of Ly6Chi monocytes in the dura in aCSF and LPS-treated mice. c, Representative flow plots of LSKs in the skull BM of aCSF and LPS-treated mice. d, Quantification of the proportion of CD45+ immune cells and absolute number of neutrophils and Ly6Chi monocytes in the dura of aCSF and LPS-treated mice. n = 5 mice per group. Mean ± SEM. p values represent a two-sided Student’s t test. e, Quantification of the proportion of live cells and the proportion of actively proliferating Ki67+ stem/progenitor (LSK, MDP, cMoP, GMP, GP) and myeloid (neutrophils, Ly6Chi monocytes) cells in the skull bone marrow of aCSF and LPS-treated mice. n = 5 mice per group. Mean ± SEM. p values represent a two-sided Student’s t test.

