FIGURE 3.

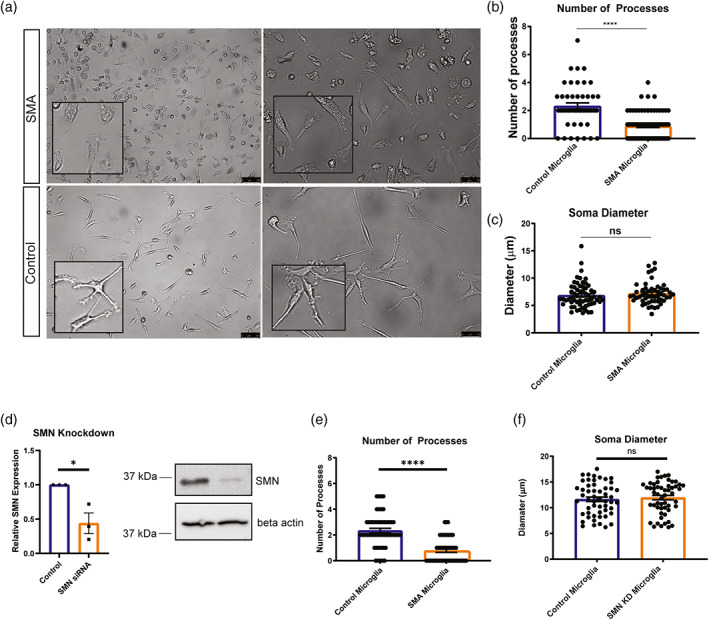
Microglia processes are retracted in iPSC derived SMA microglia. (a) Representative bright field images show control and SMA patient iPSC‐derived microglia at 10 days post differentiation. Scale bars = 100 μm (left panel) and 50 μm (right panel). (b) Number of processes (3 independent experiments were performed; a minimum of 45 microglia were counted per group). (c) Soma diameter (3 independent experiments were performed; a minimum of 50 Iba1+ microglia were counted per group) were analyzed using ImageJ. (d) Microglia derived from control cells were treated with siRNA to SMN and SMN knockdown confirmed by RT‐PCR and western blots. (e) Number of processes (3 independent experiments were performed; a minimum of 45 microglia were counted per group) following SMN knockdown in control cells. (f) Soma diameter (3 independent experiments were performed; a minimum of 50 Iba1+ microglia were counted per group) were analyzed using ImageJ following SMN knockdown in control cells. All groups were analyzed by unpaired t‐test. ****p < .0001. Values represent mean ± SEM
